Let’s Get Started with Jeffrey App
Today, I’m happy to announce the 0.3 release of Jeffrey App - Jeffrey App. There are some new features and improvements, let’s have a look at them!
Start the jar file using the following command:
java -jar jeffrey.jar
or you can spin up docker container with the following command, and check the features with predefined examples.
docker run -it -p 8585:8585 petrbouda/jeffrey-examples
Open the browser: http://localhost:8585
New Features
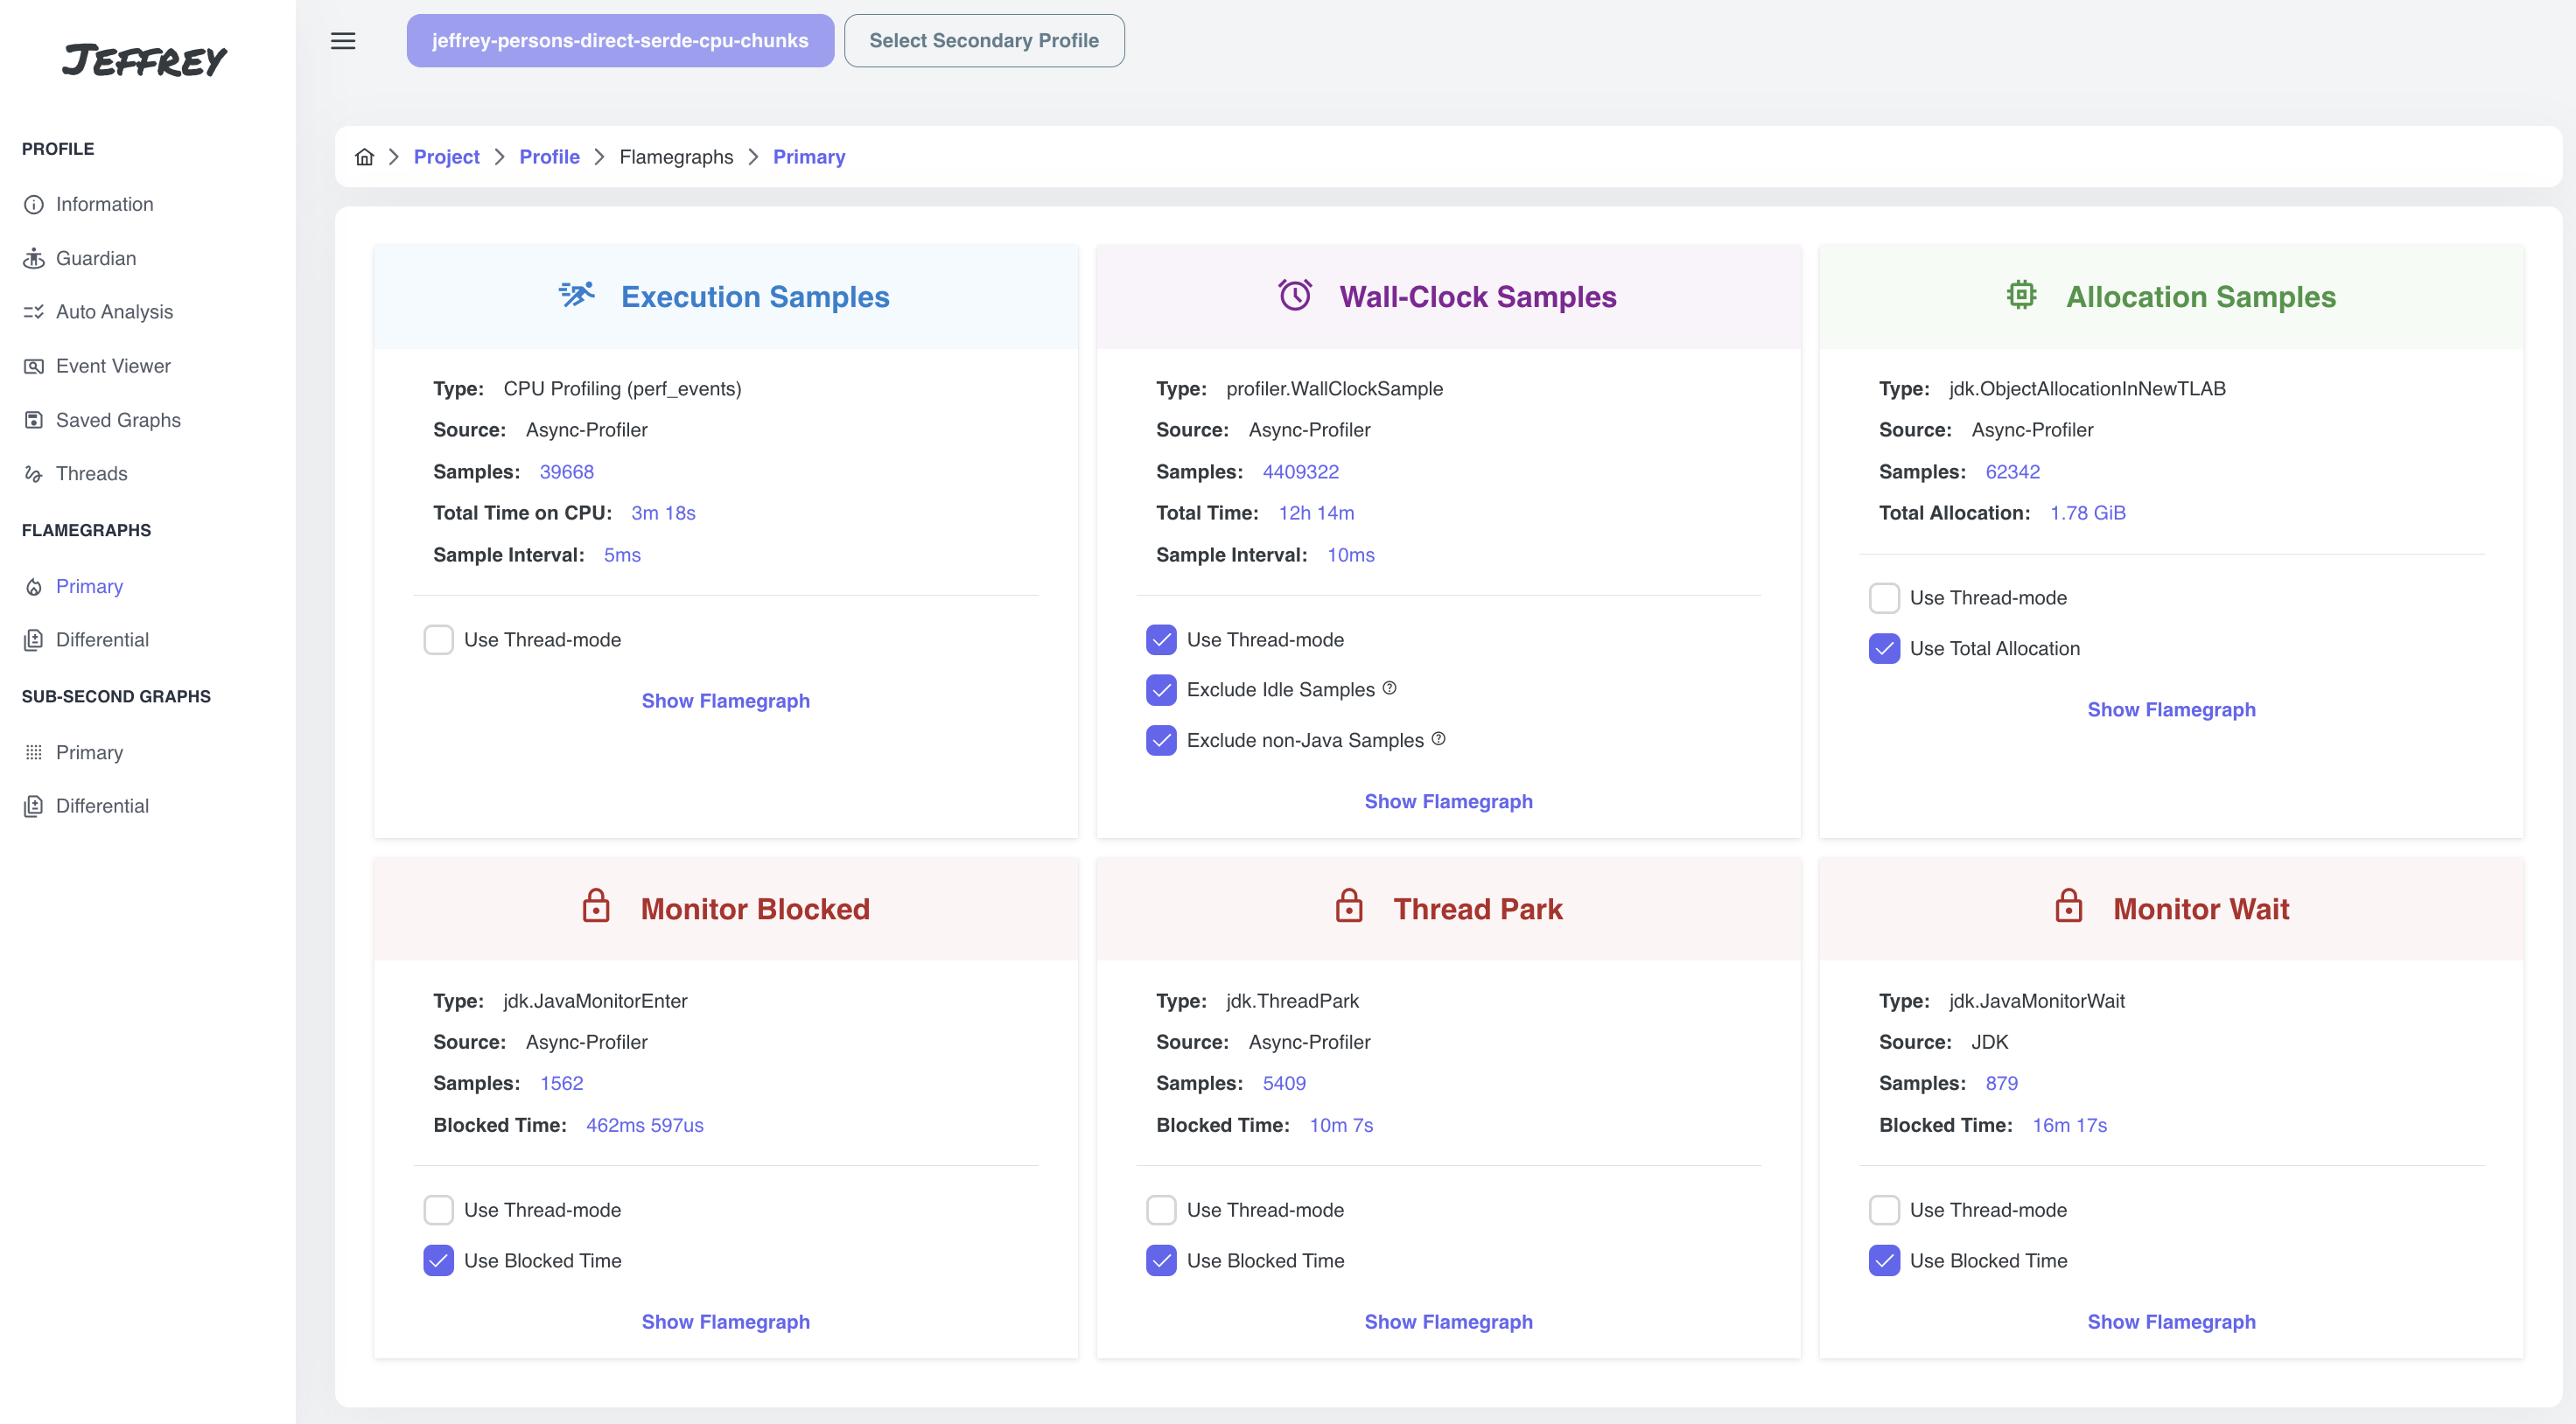
Support for latest/greatest Async-Profiler - Wall-Clock Profiling
The latest version of Jeffrey App is now compatible with the latest version of Async-Profiler. The newest version (not yet released) brings a lot of improvements especially in the area of Wall-Clock profiling.
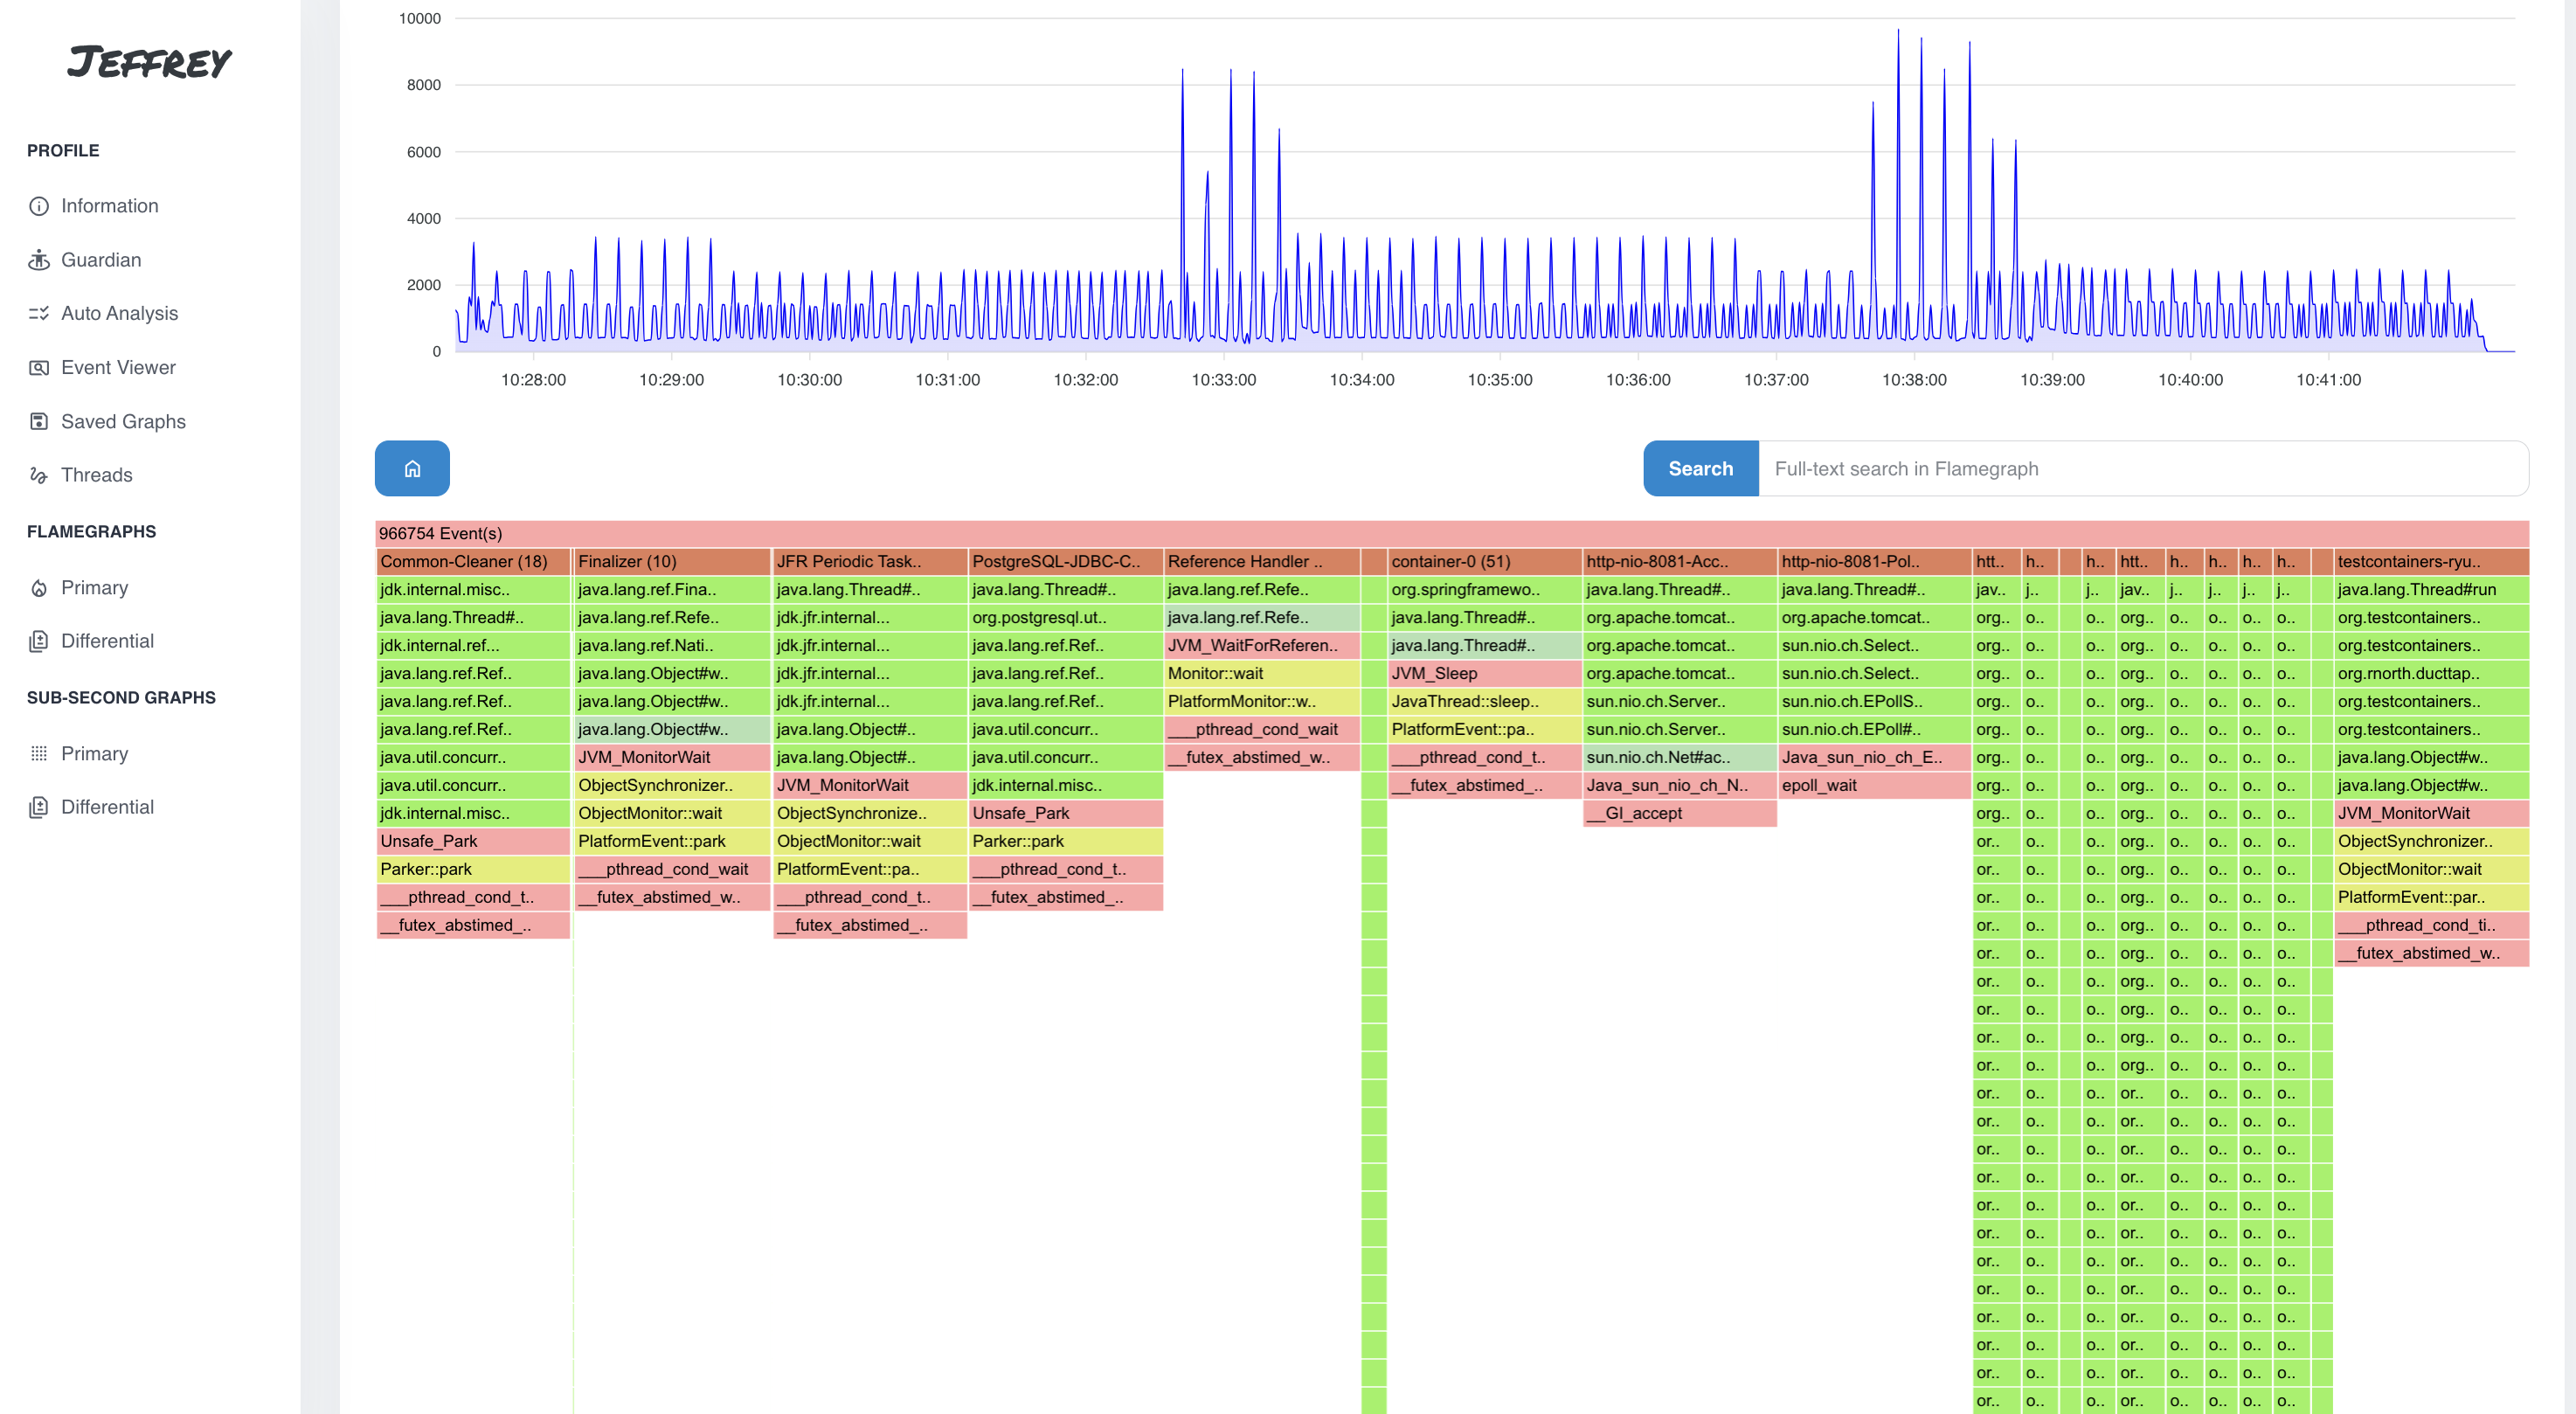
Wall-Clock profiling is a very useful feature for profiling the startup of the application and looking for increased latency in the application. Wall-Clock profiling suffered from the high overhead of the profiler itself, but the latest version brings a lot of improvements in this area. It can optimize the sampling of threads that don’t have any activity from the last sampling period, therefore, it can reduce the overhead of the profiler significantly. Moreover, Wall-Clock gets a new type of event: profiler.WallClockSample and one event can represent multiple samples to reduce the size of the recording.
The Async-Profiler config below can be used for Wall-Clock profiling (just an example):
-agentpath:$ASPROF_HOME/lib/libasyncProfiler.so=start,event=ctimer,wall=10ms,loop=1h,jfrsync=default,chunksize=10m,file=/tmp/app-%t.jfr
- it samples ctimer as Execution Samples (useful for containerized environments)
- it samples wall as Wall-Clock Samples (useful for startup profiling)
- loops every hour - creates a new file every hour
- jfrsync - starts and synchronizes the recording with the JFR recording
- chunksize - is set to 10MB creates chunks of 10MB inside the binary files to improve parallel processing of Jeffrey
- /tmp/app-%t.jfr - a pattern rolling binary JFR files every hour
Thread-View
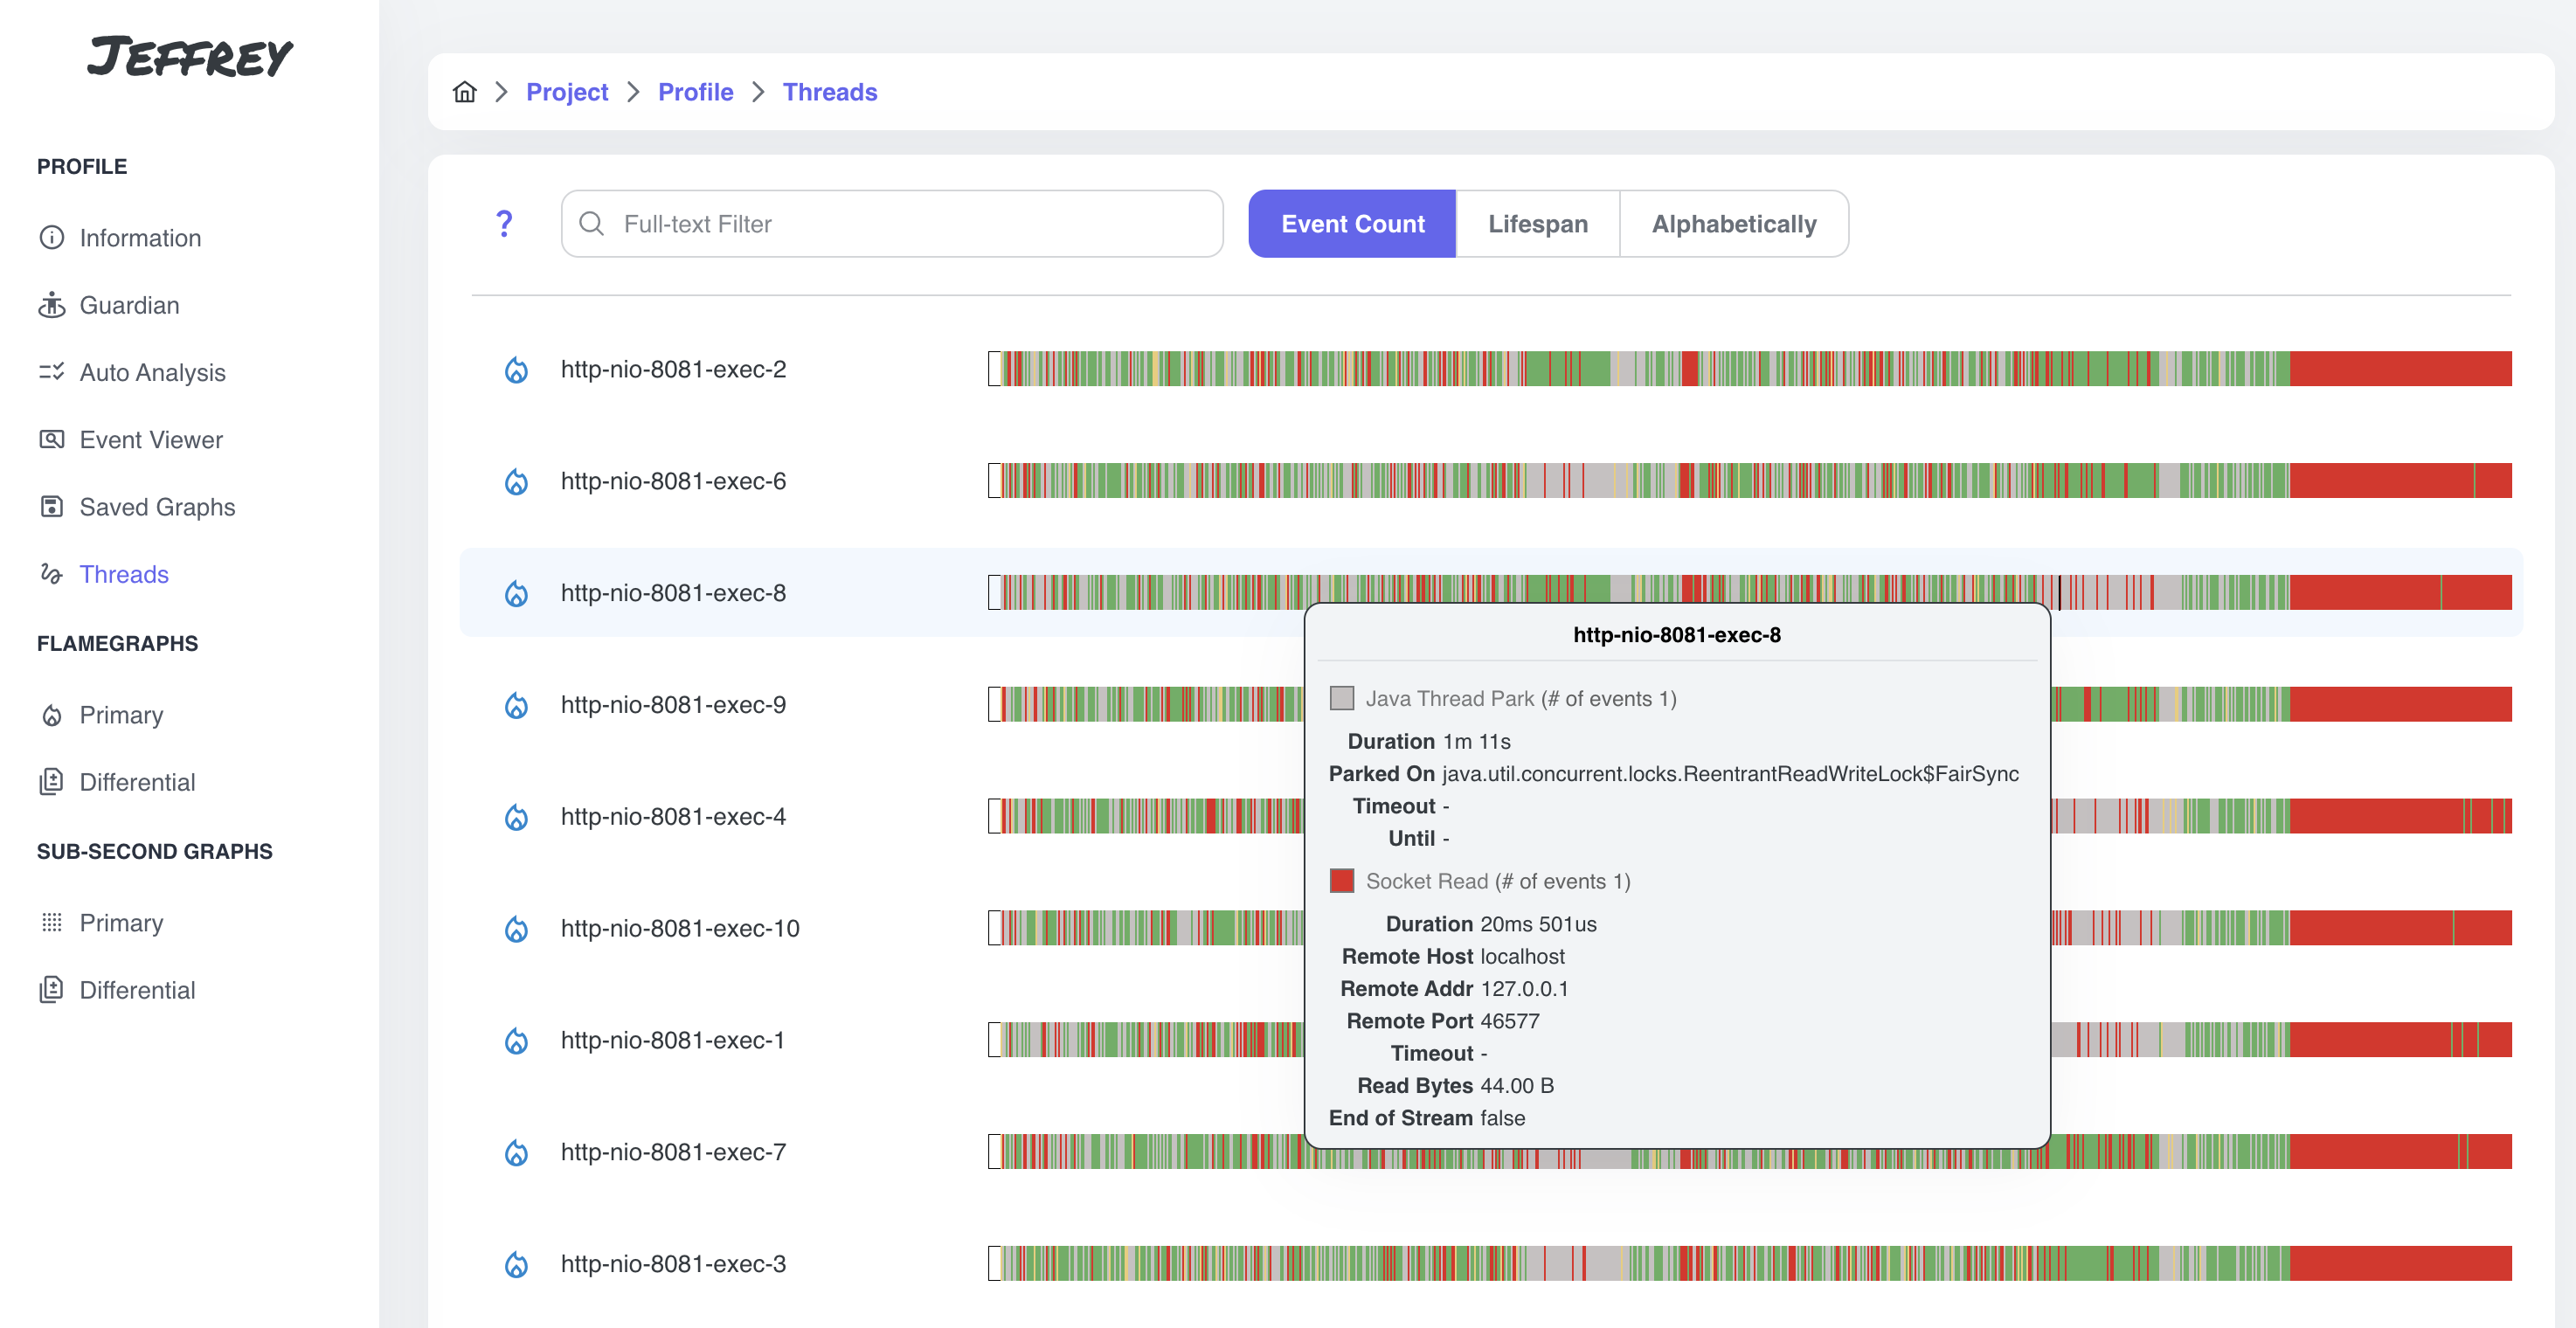
Jeffrey App now supports the Thread-View. It’s a very useful feature for profiling the application in the context of threads. Currently, it supports multiple events that can cause significant latency:
Event Types
| Thread Park | Parking of the thread: LockSupport#park() (e.g. parking threads in Thread Pools) |
| Thread Sleep | Threads Sleep, emitted by Thread#sleep() |
| Thread Wait | Thread Wait, emitted by Thread#wait() |
| Monitor Enter | Blocked thread, caused by MonitorEnter (e.g. synchronized) |
| Socket Read/Write | Blocking reads/writes from a Socket (e.g. SocketInputStream#read, SocketOutputStream#write) |
| File Read/Write | Blocking reads from a File (e.g. FileInputStream#read, FileOutputStream#write) |
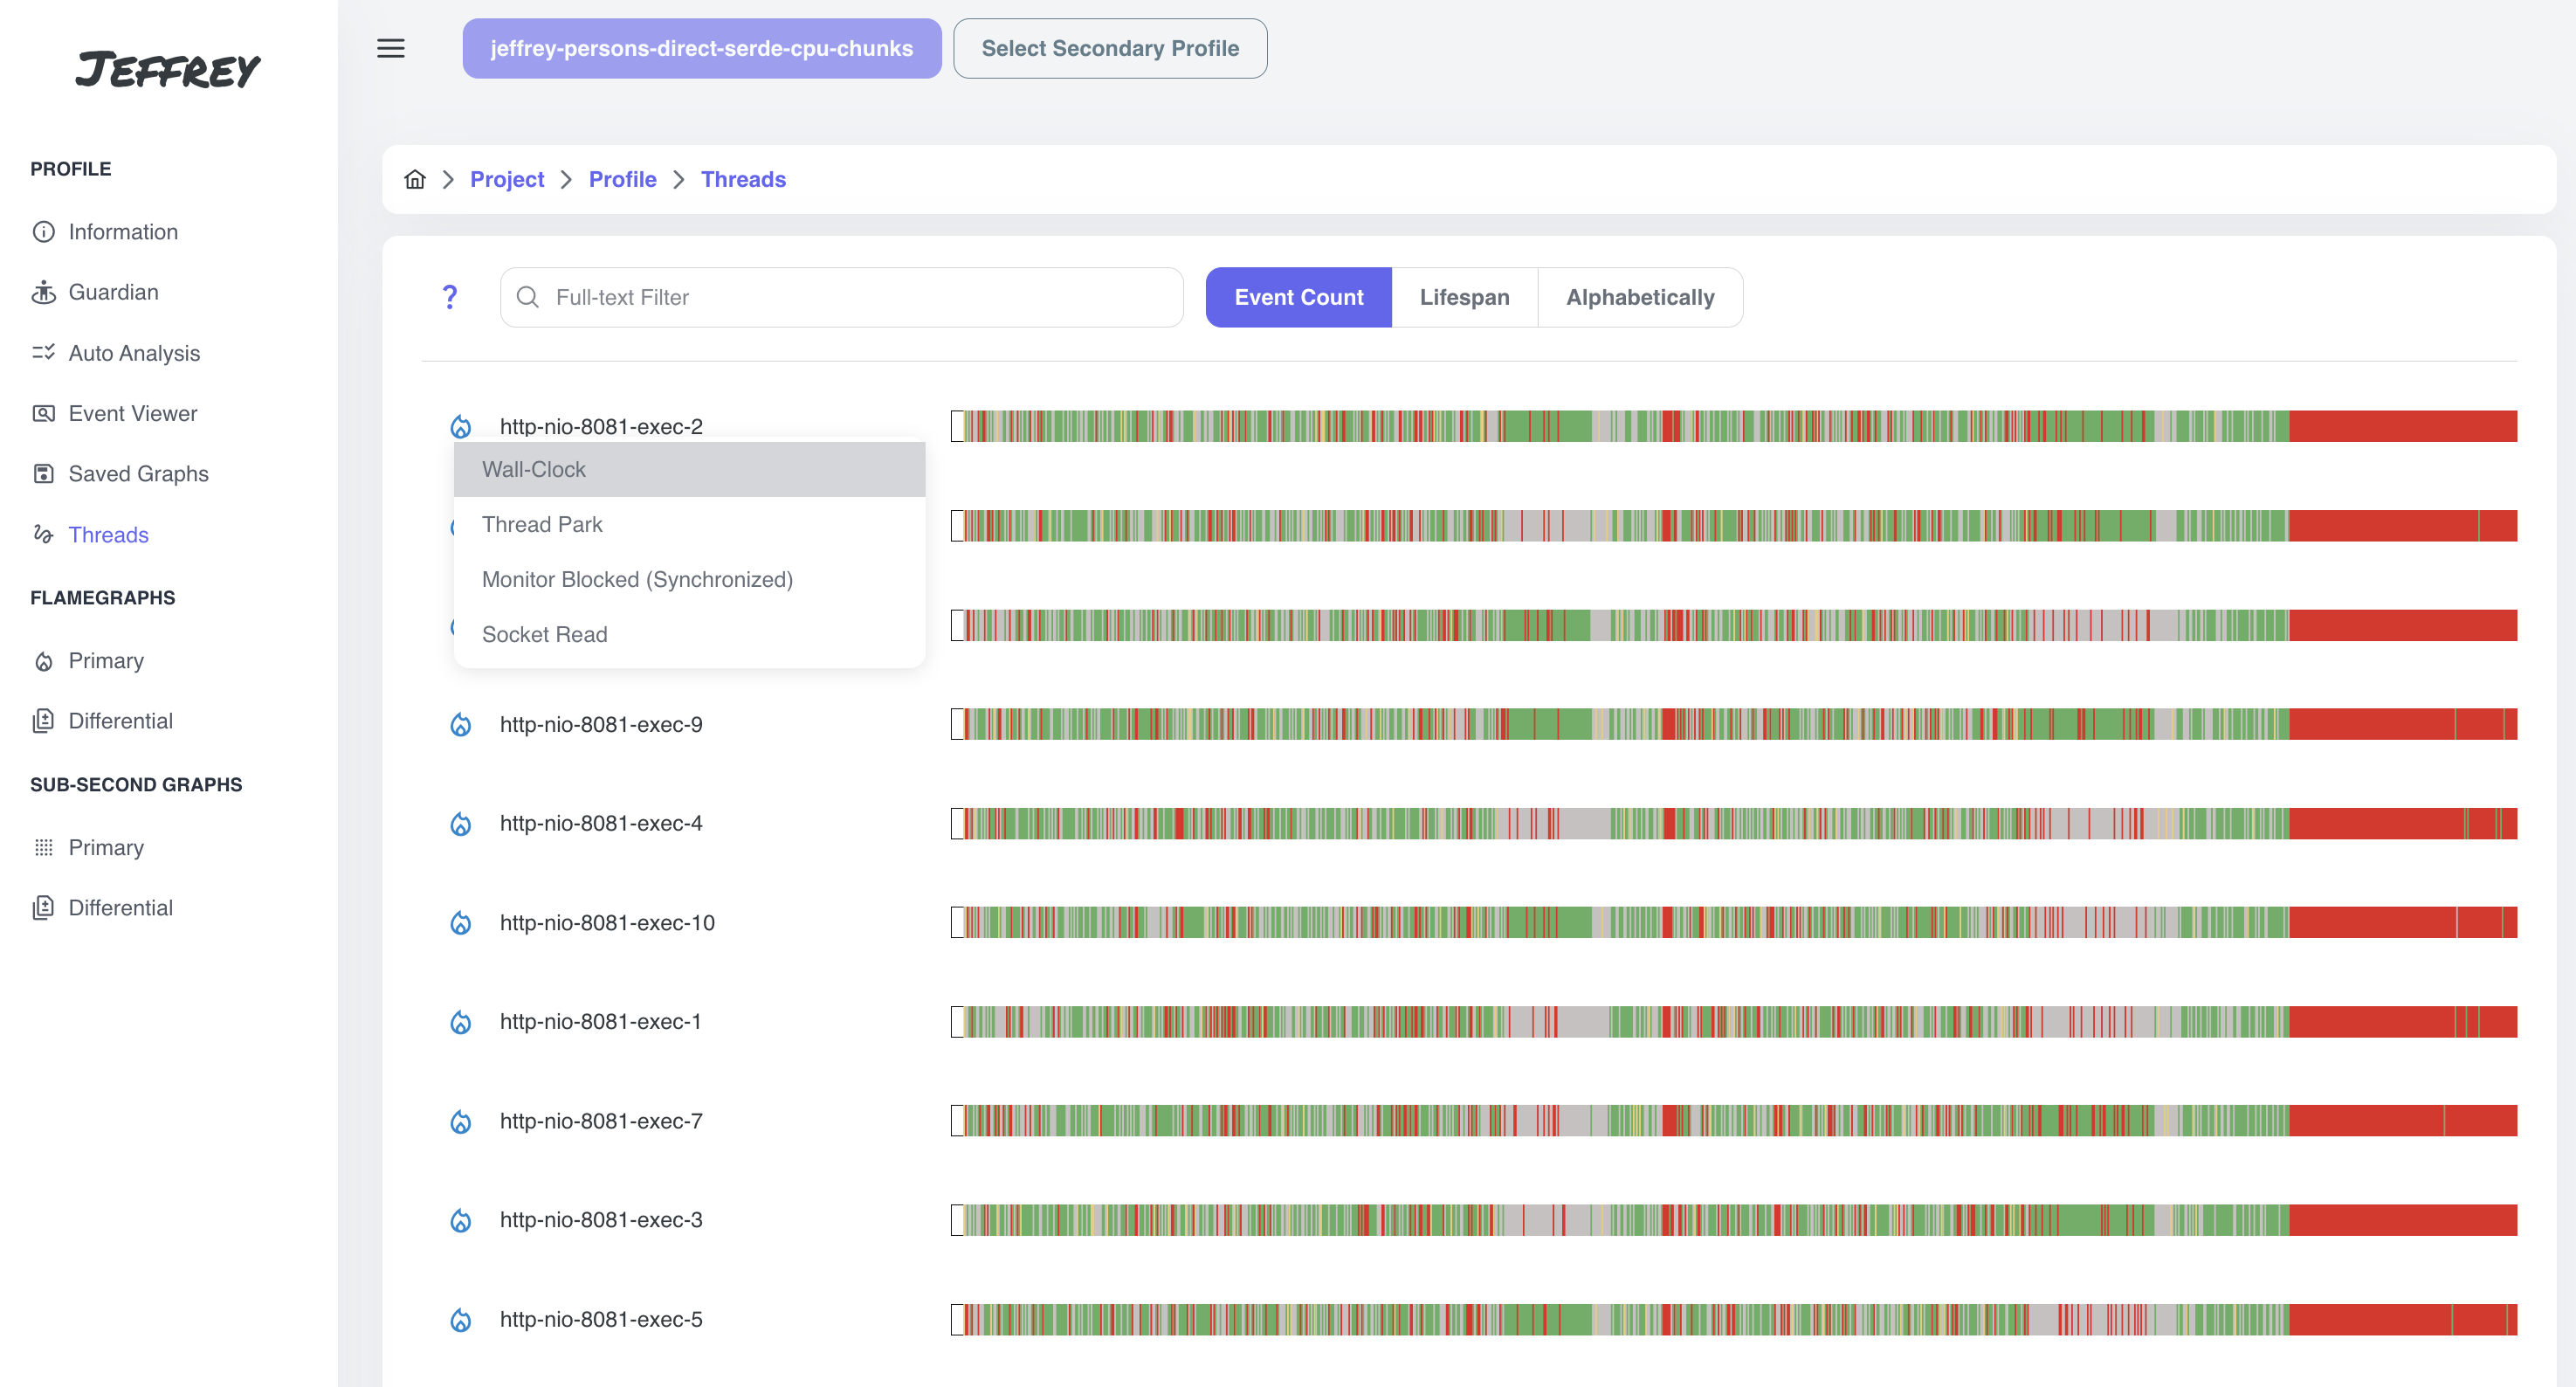
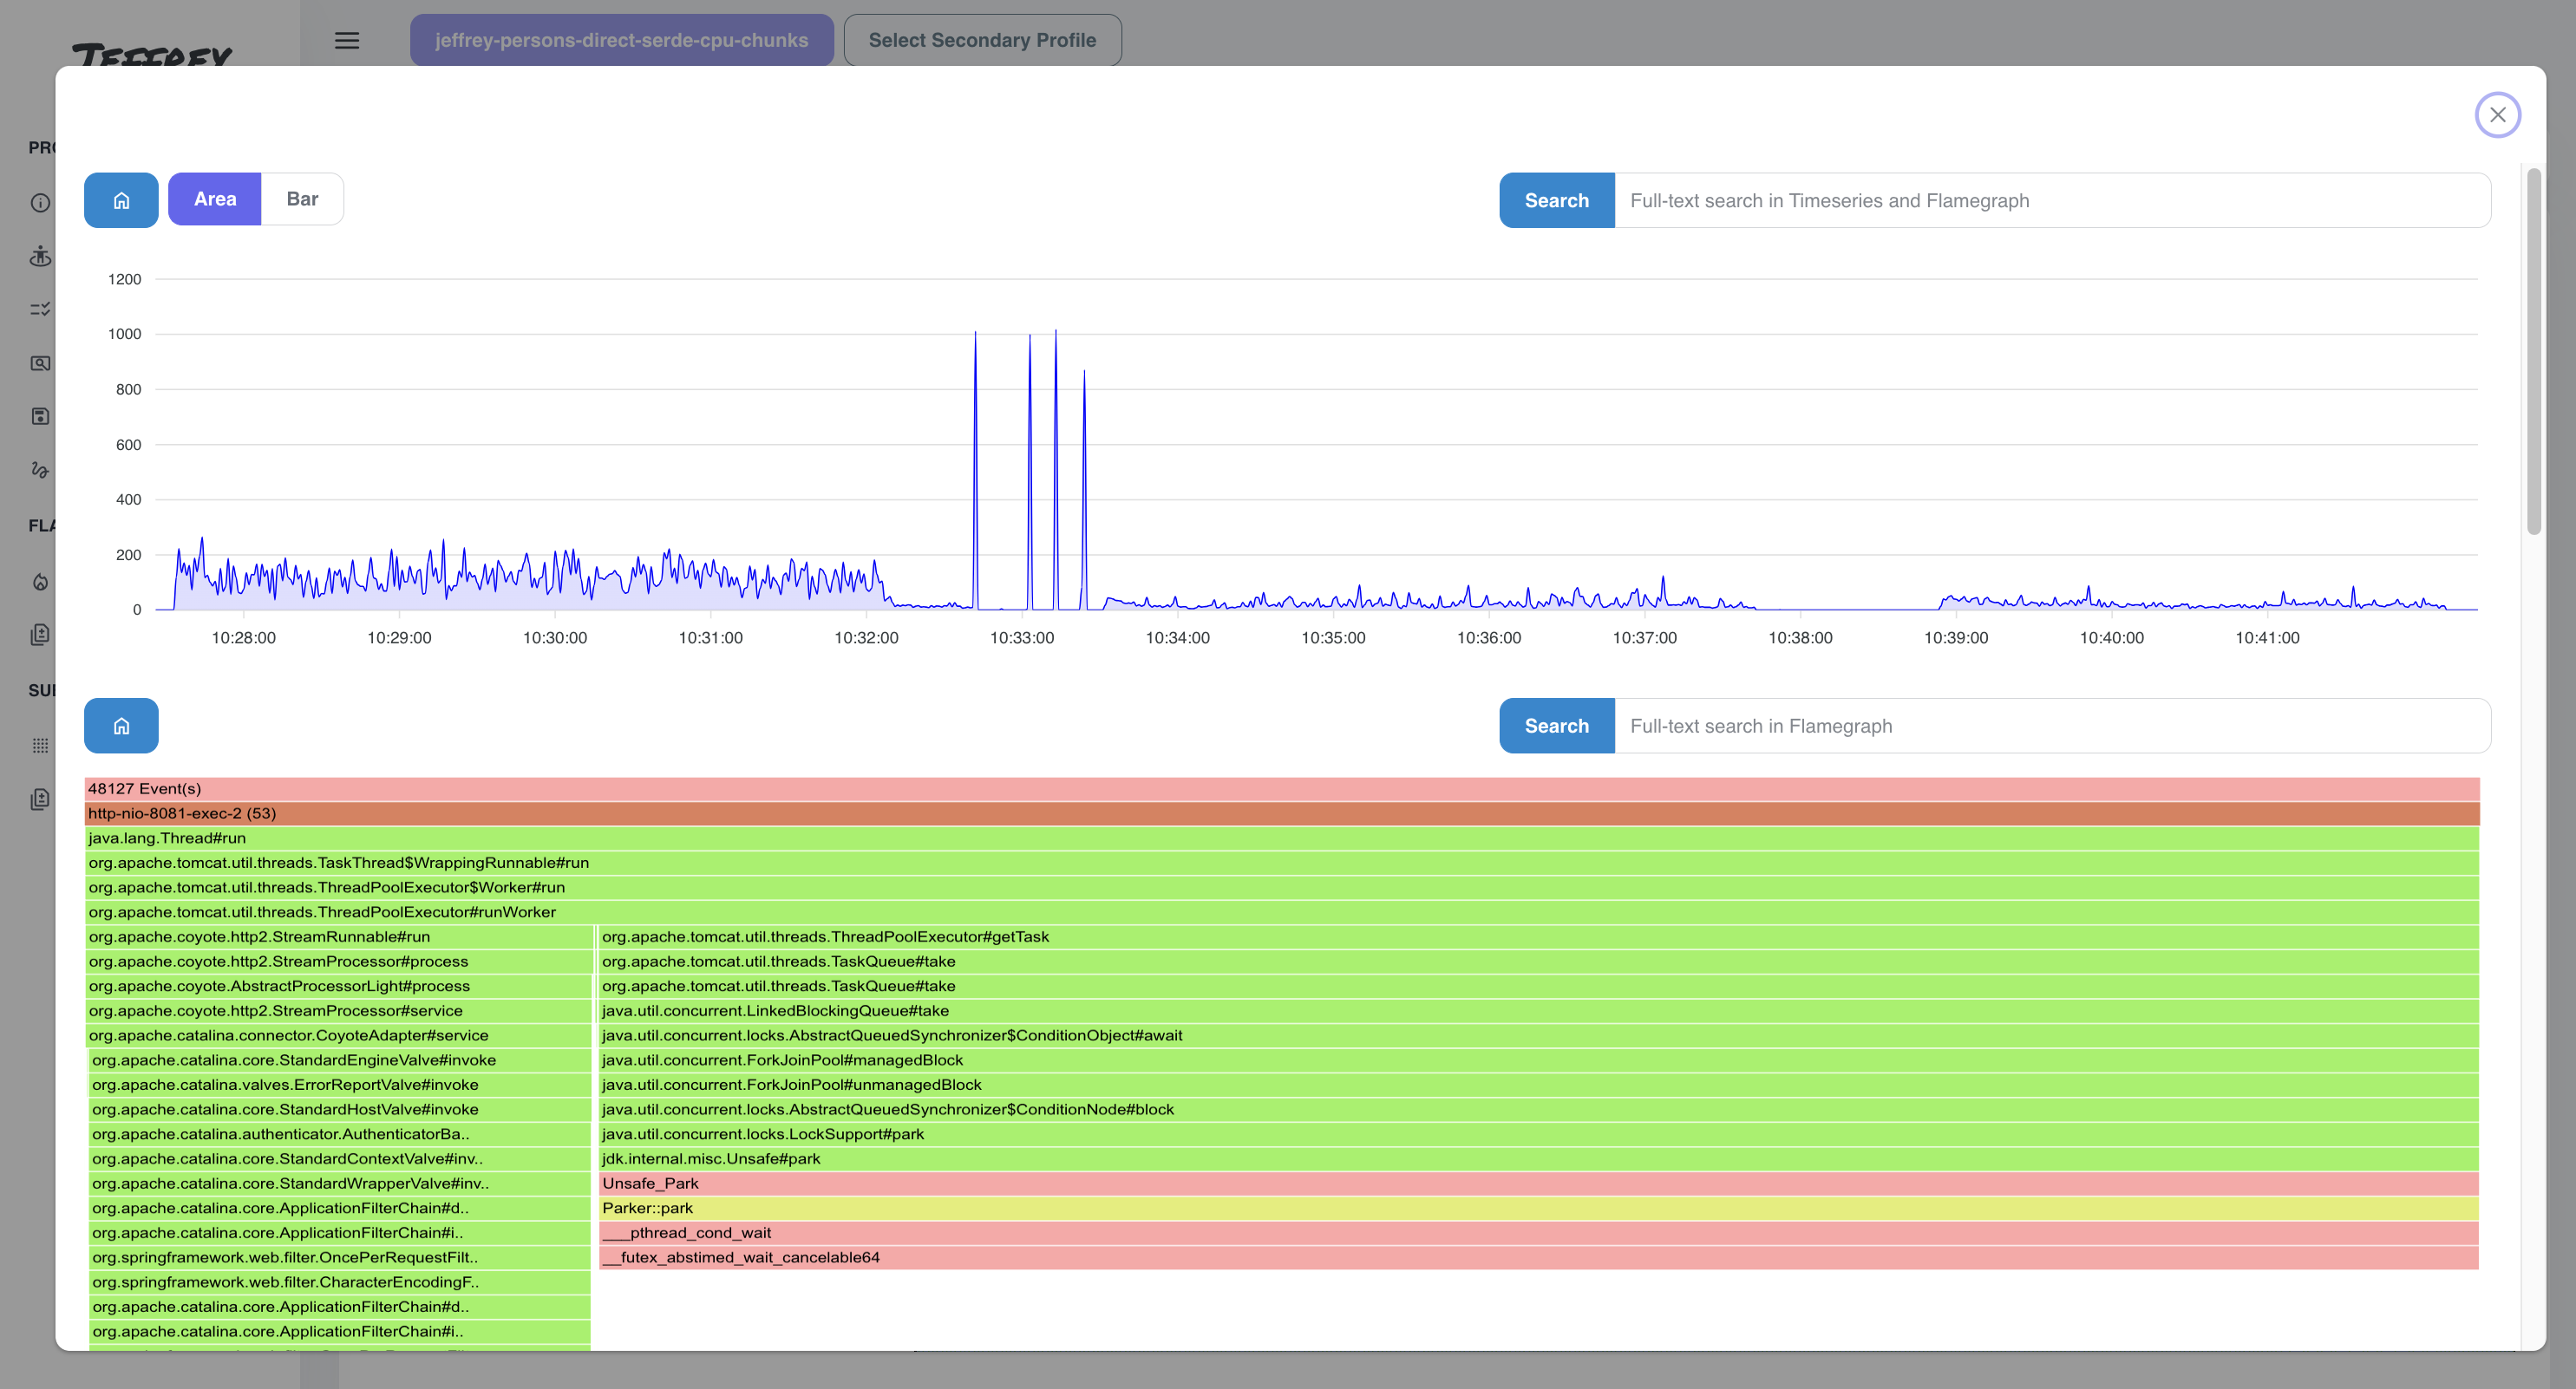
Thread-View shows the lifespan of the threads and the events that occurred during the thread’s lifetime. We can get the detail of the event by pointing to thread’s timeline. To investigate further, we can generate a flamegraph representing the particular type of the event, or Wall-Clock flamegraph to see the latency in the application in general.
Guardian (Experimental)
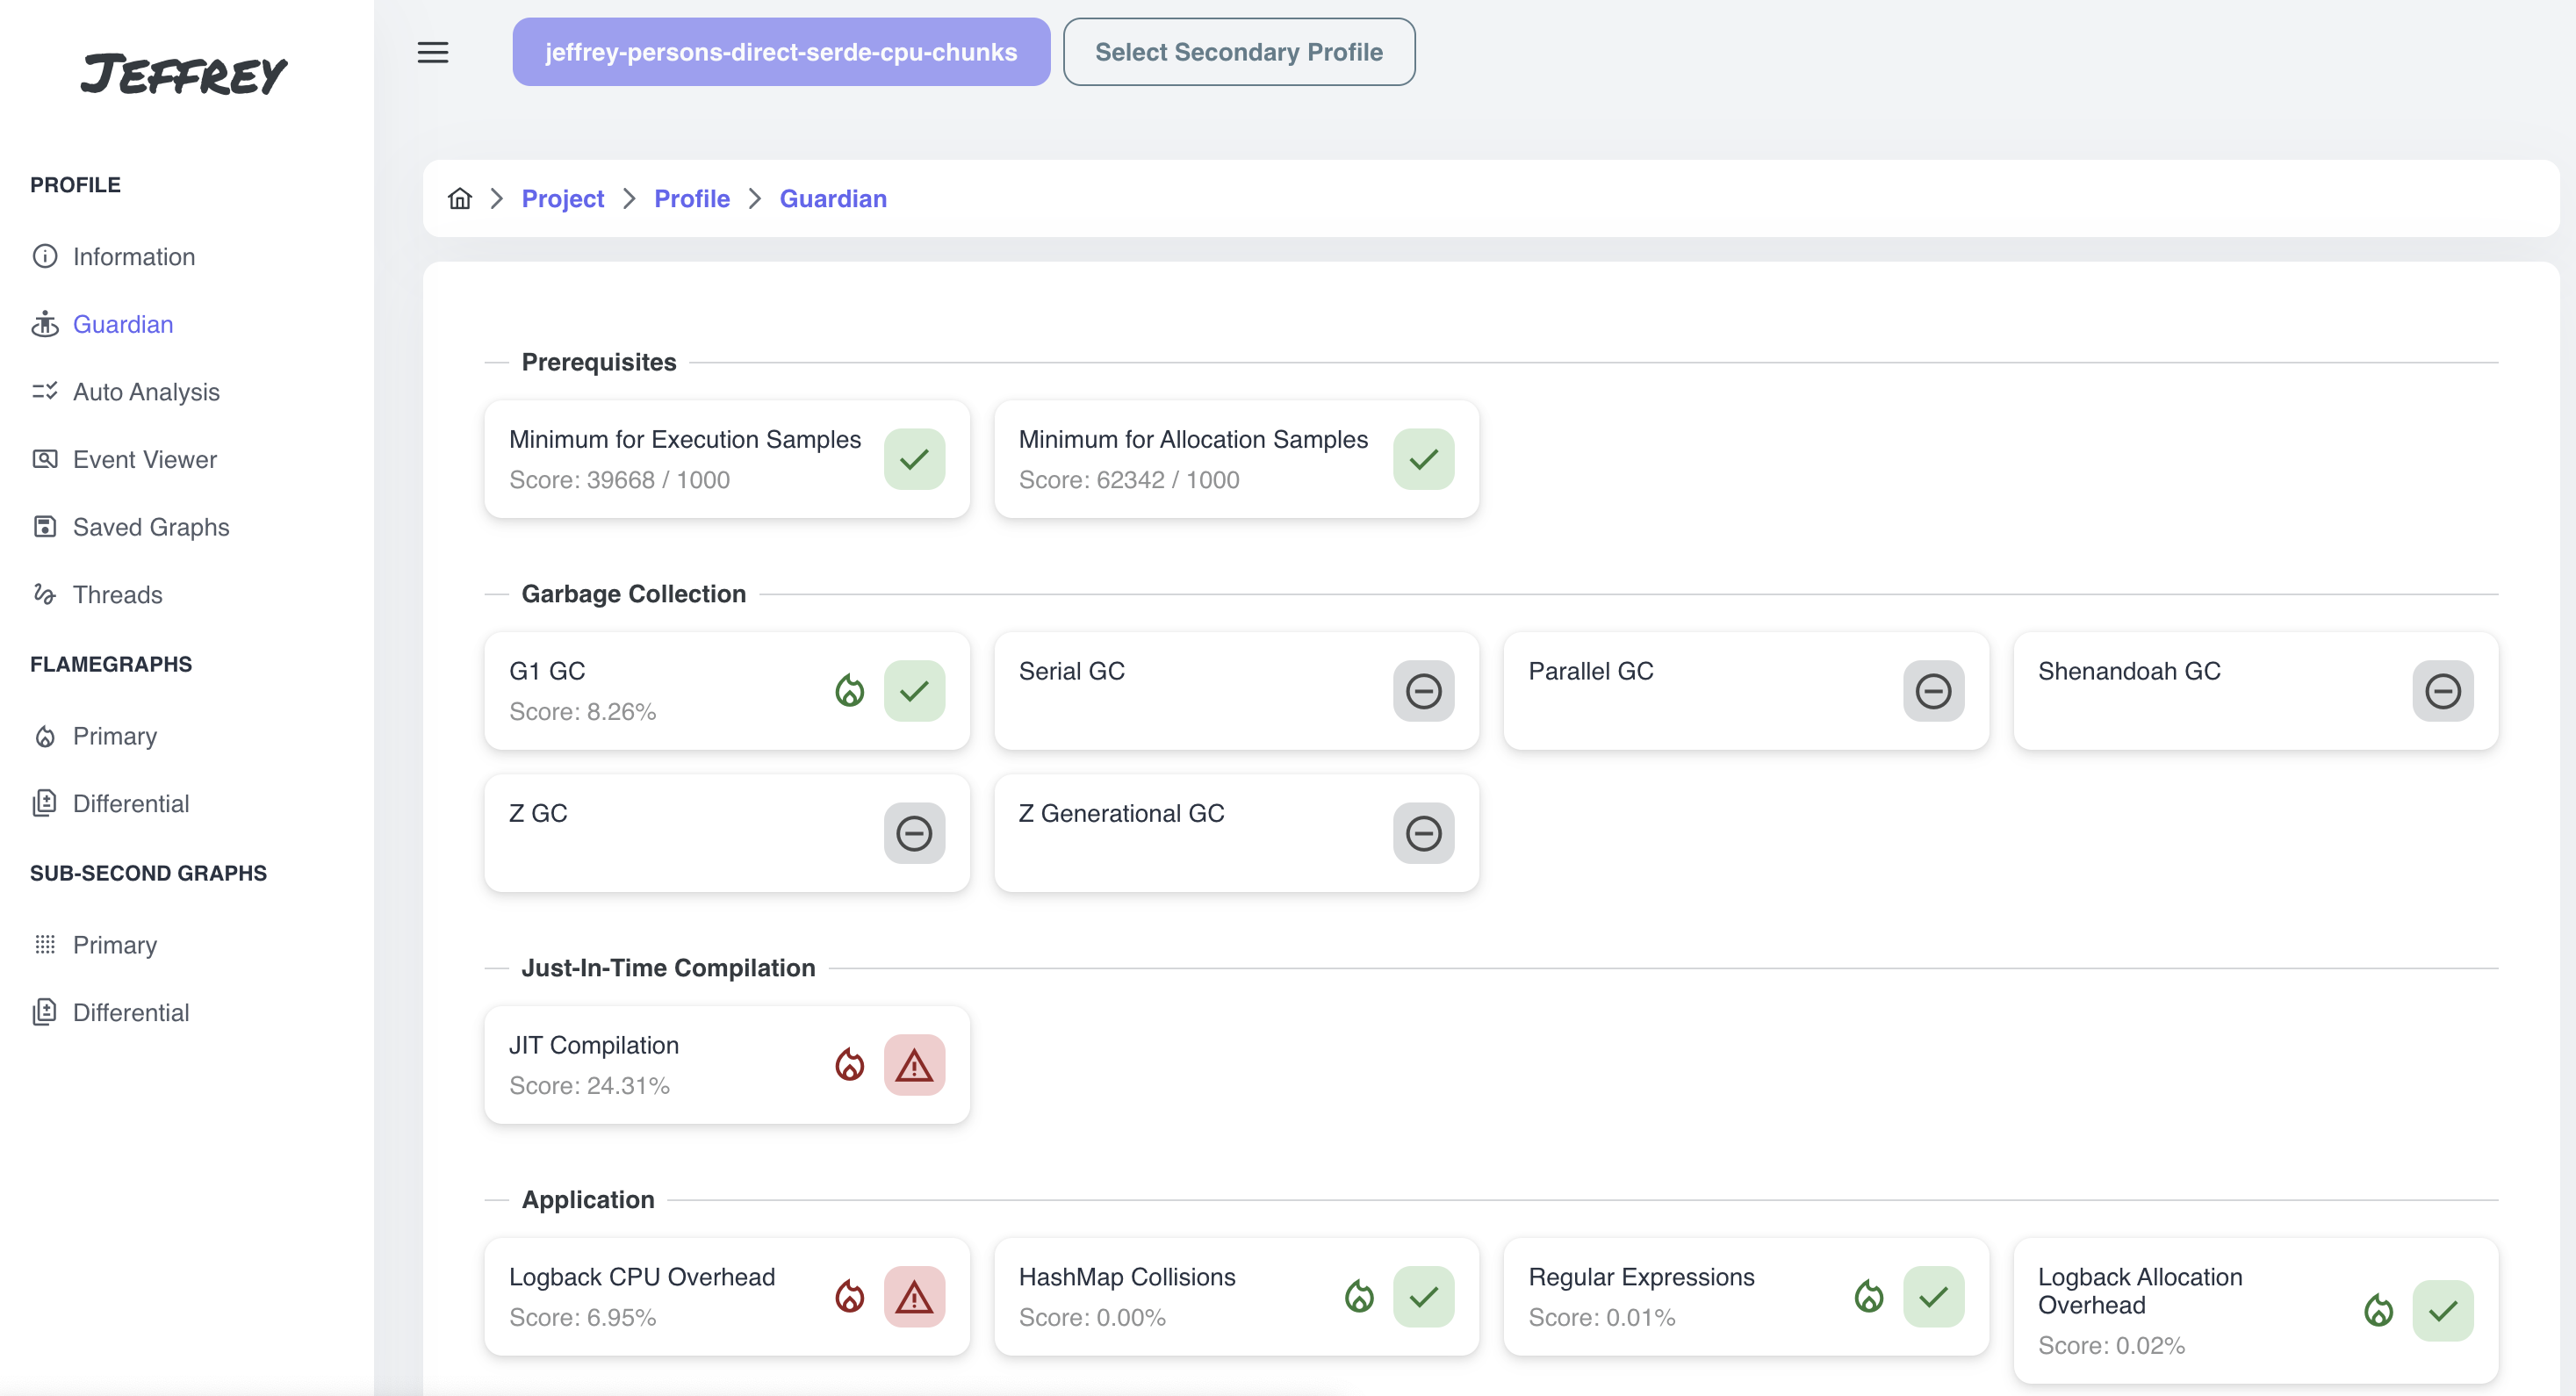
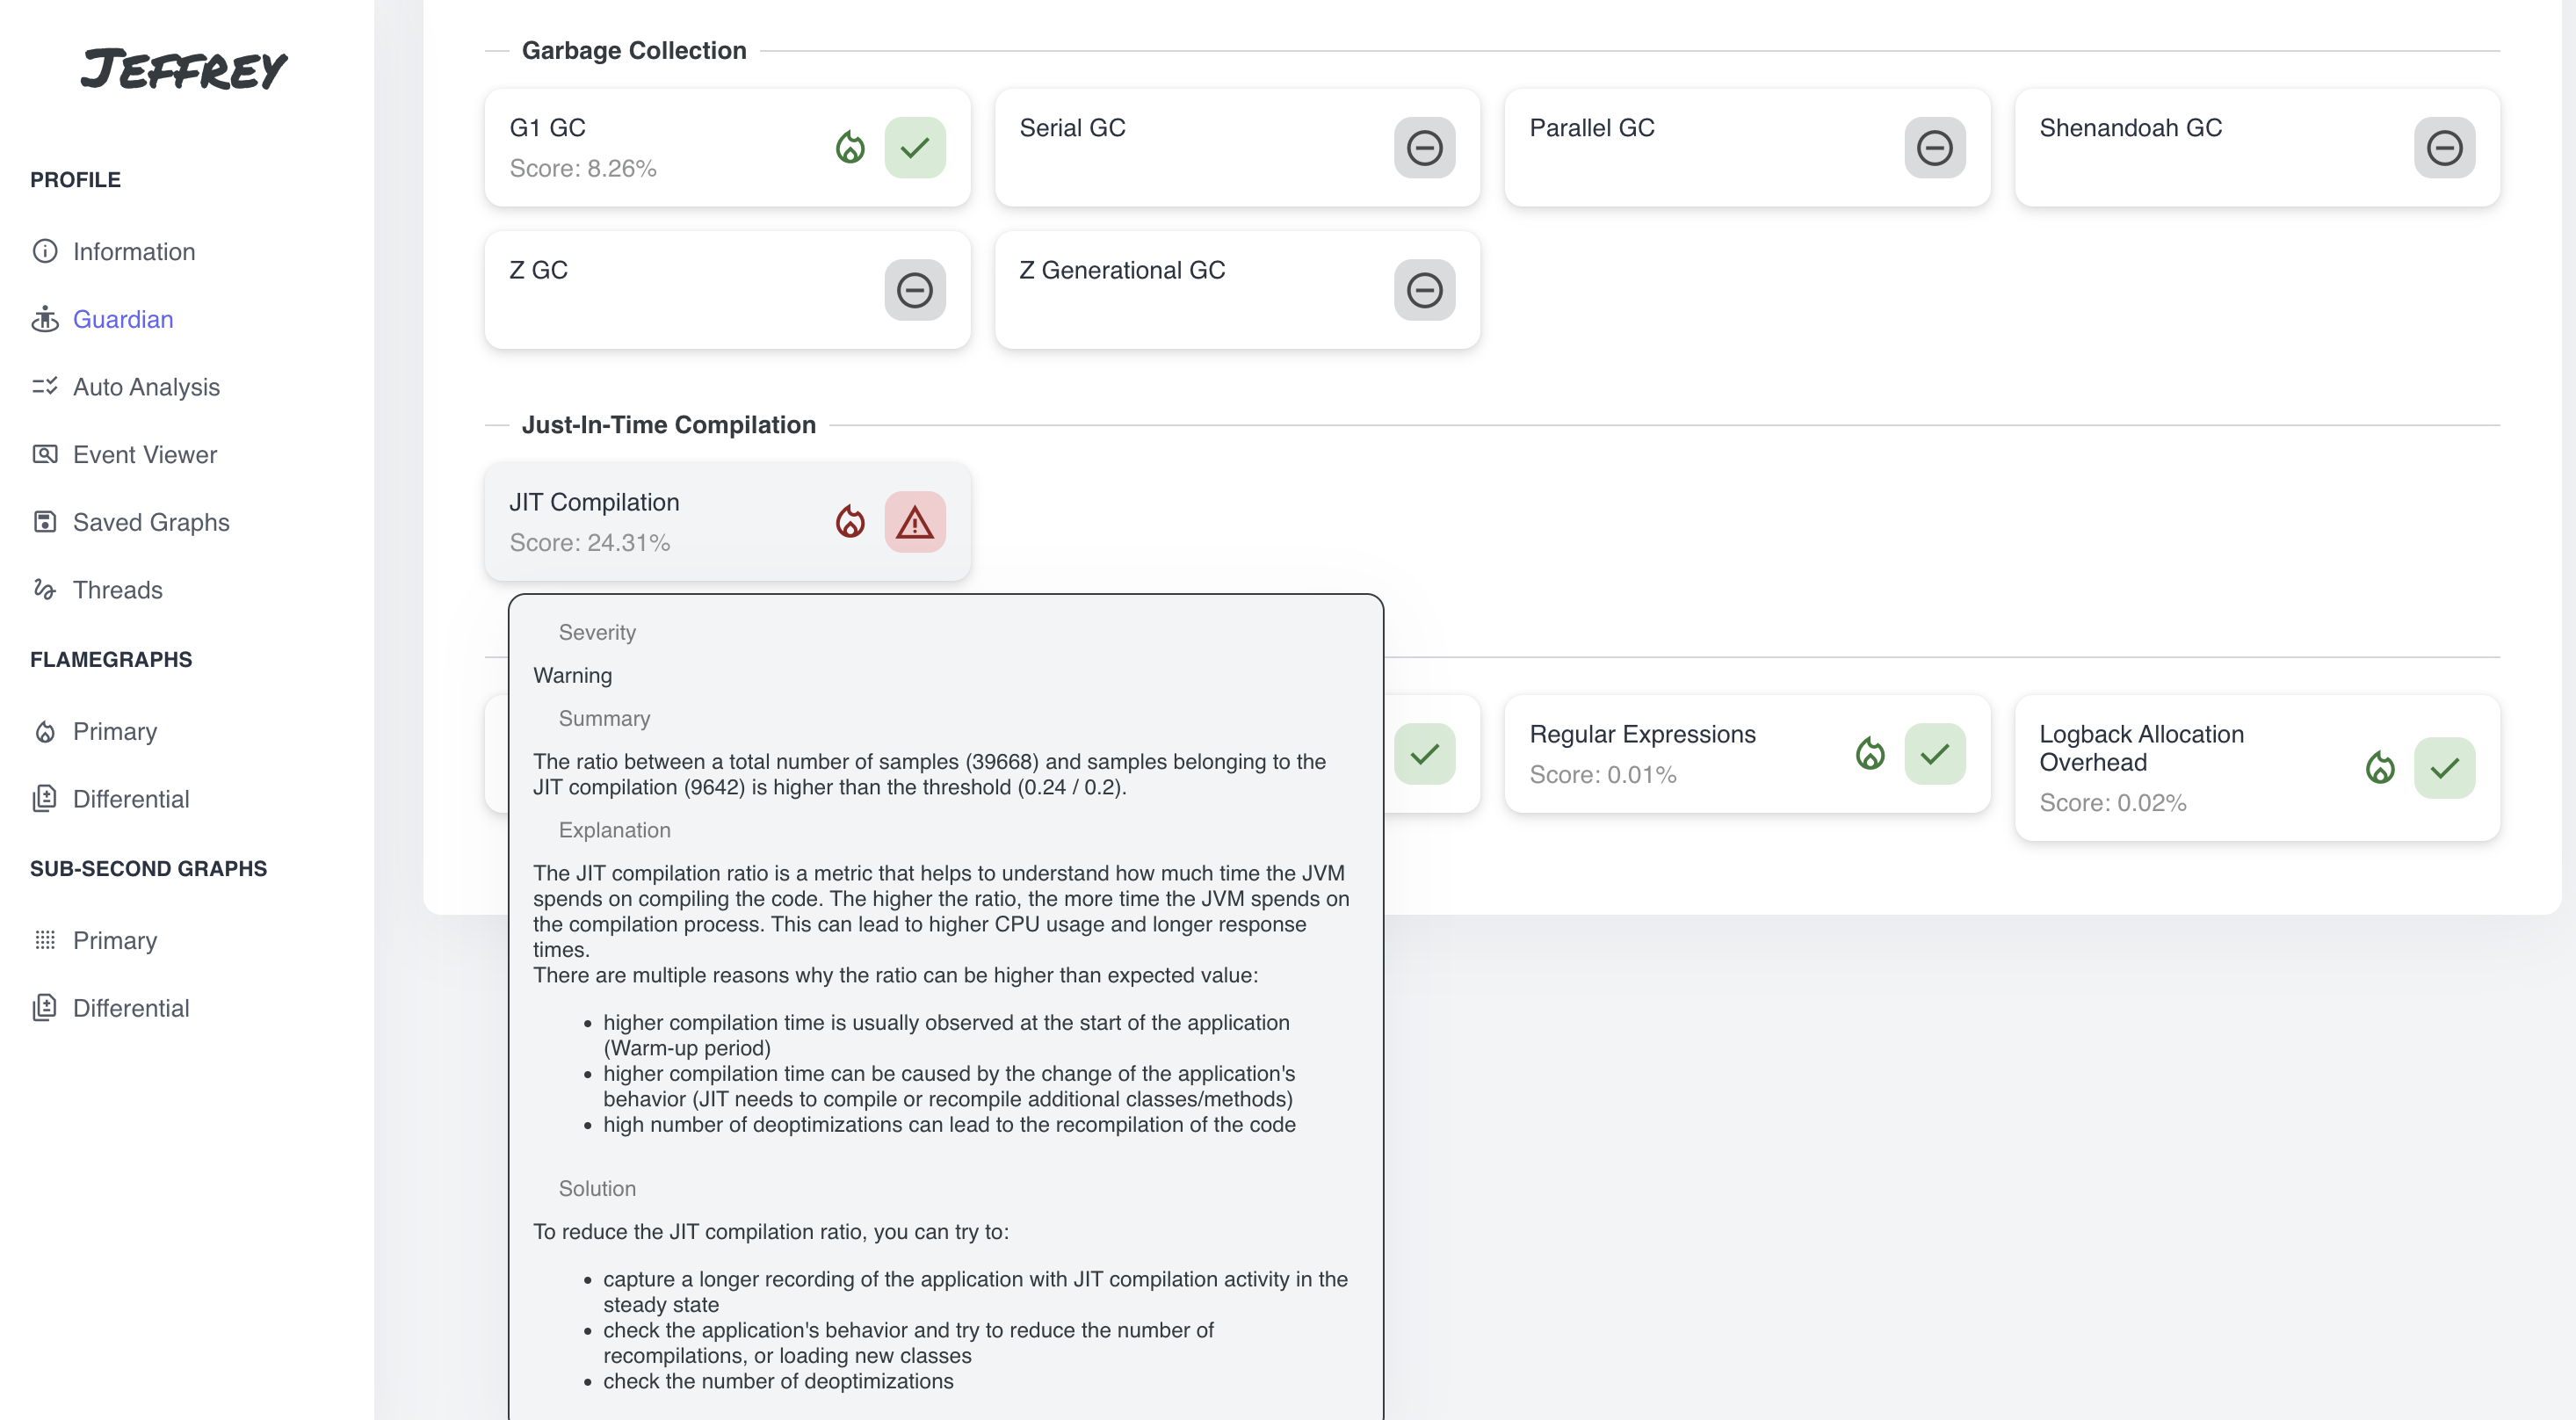
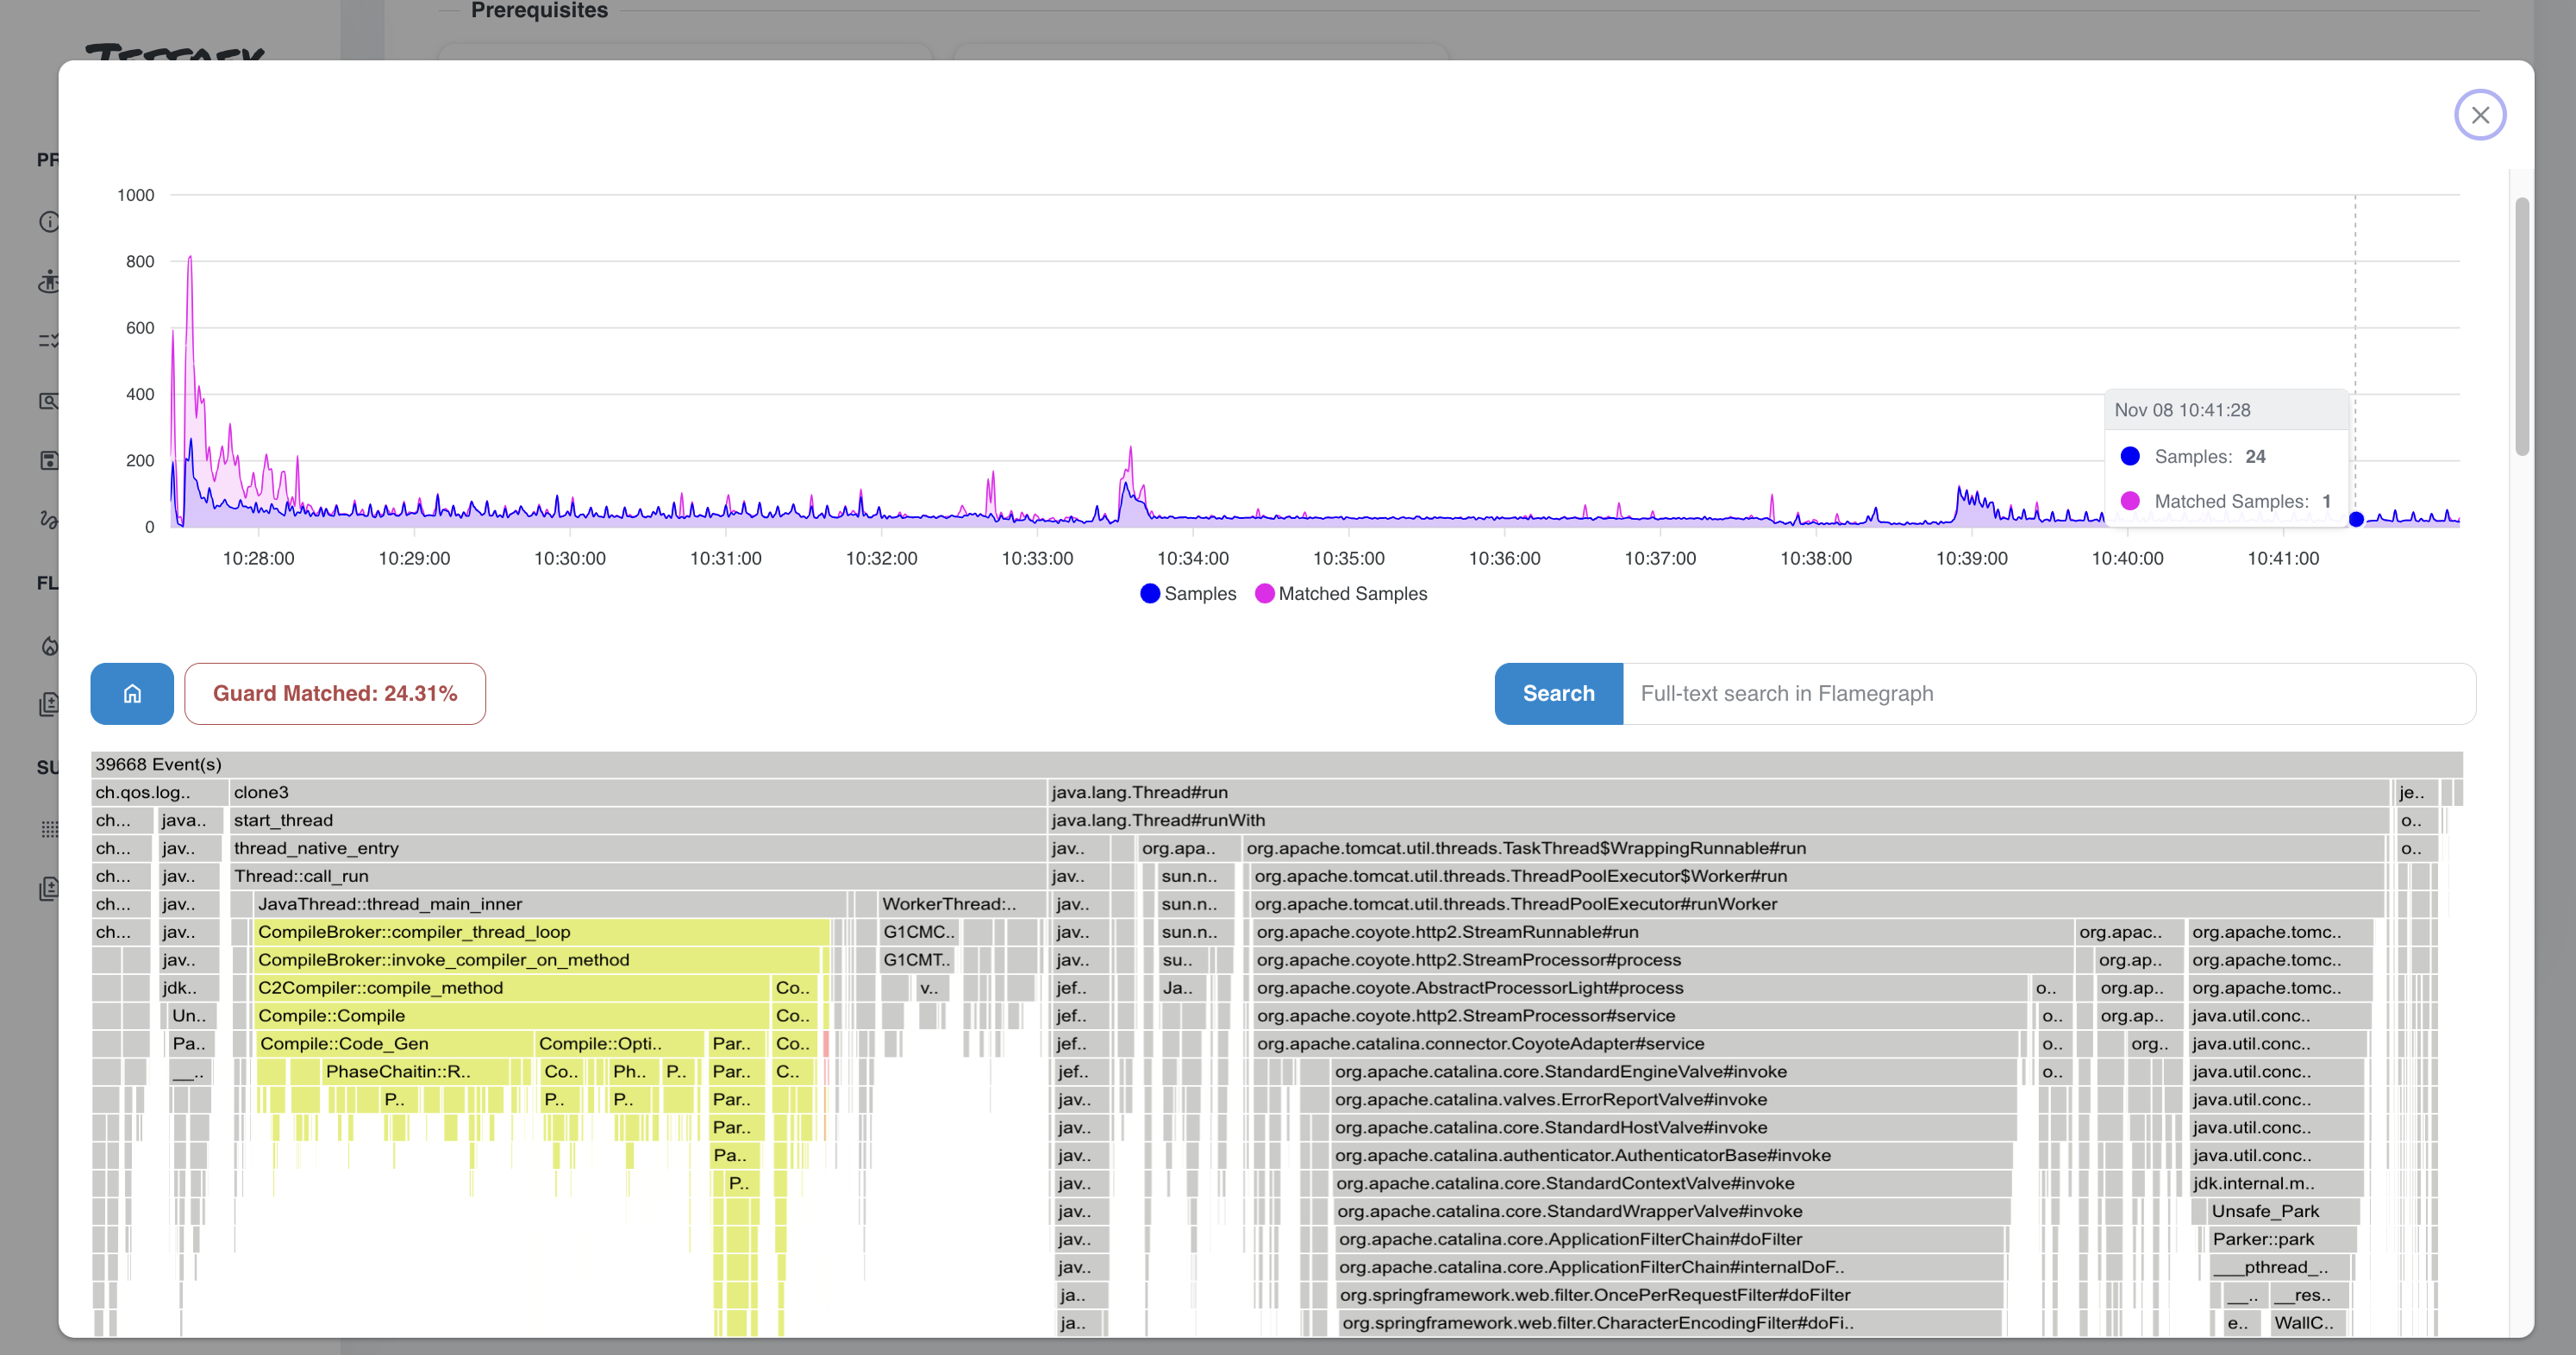
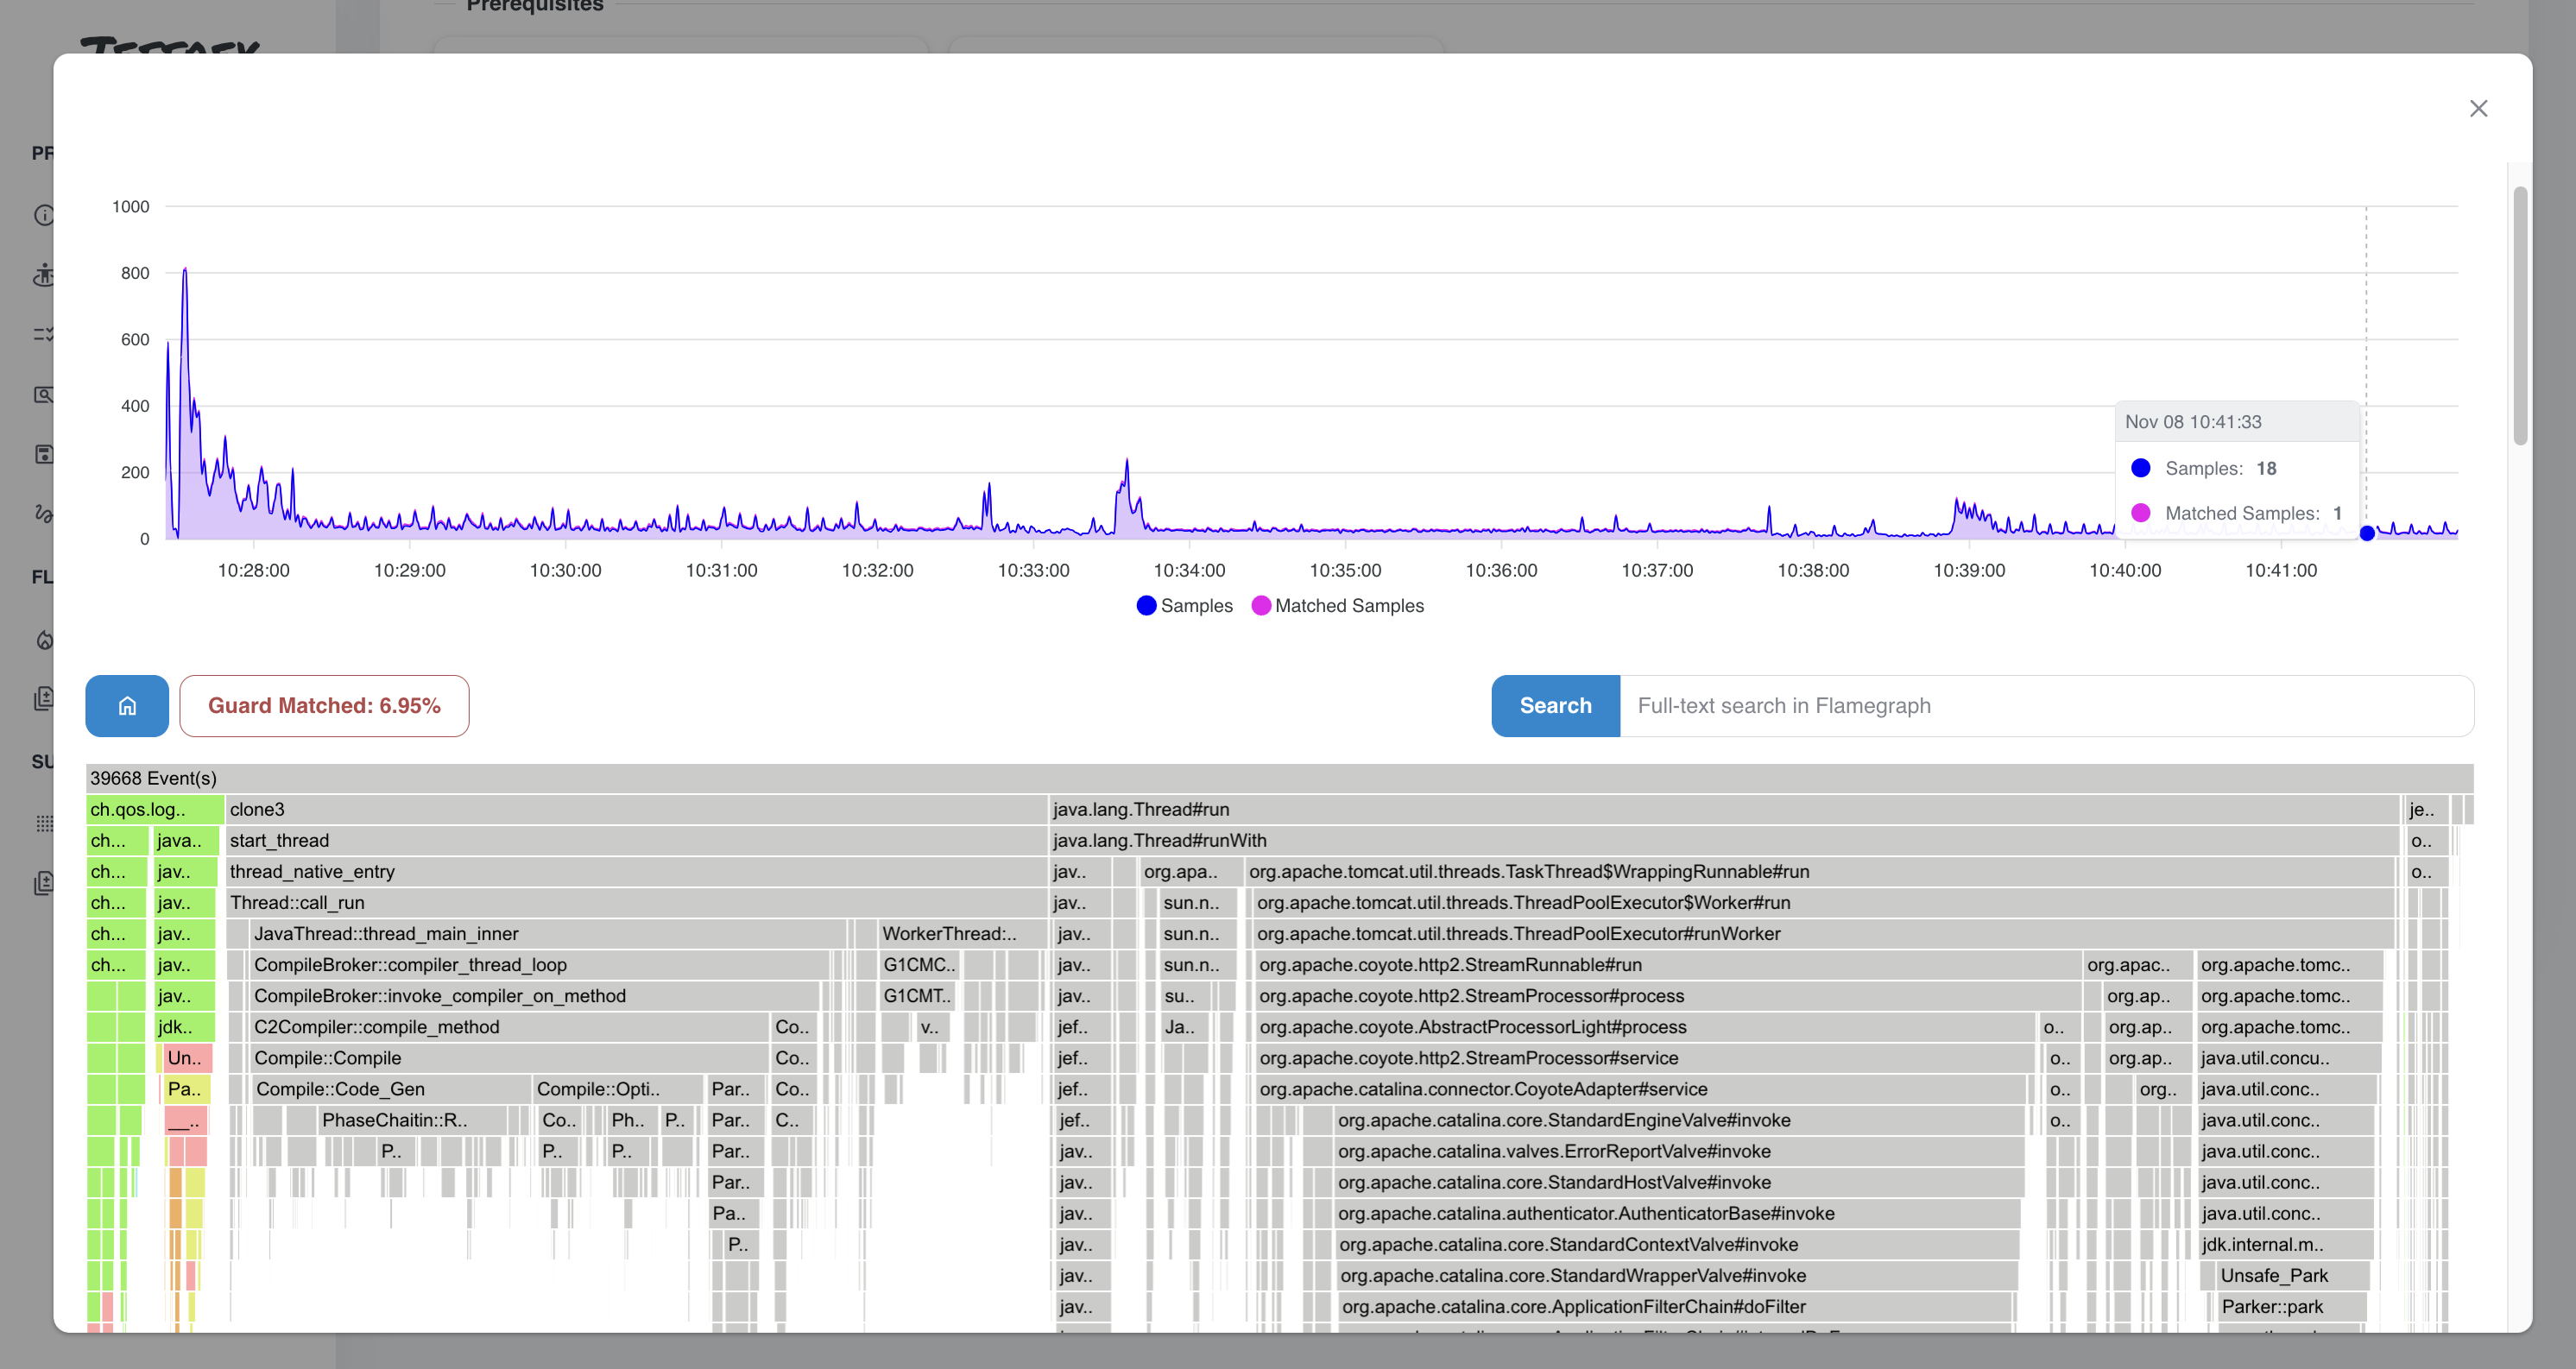
Guardian is a new feature that can help you to monitor the application automatically and provide you the output causing the suspicious behavior. It based on traversing the flamegraphs, looking for the concrete frames, and calculating the percentage of the observed frame pattern. If the percentage is higher than the threshold, it will be reported, and it provides the possibility to generate the flamegraph with the suspicious frames highlighted.
Currently, it supports hardcoded set of Guardian rules, but it’s planned to be extended with the user-defined rules in the future and make it configurable.
Support for multiple Applications
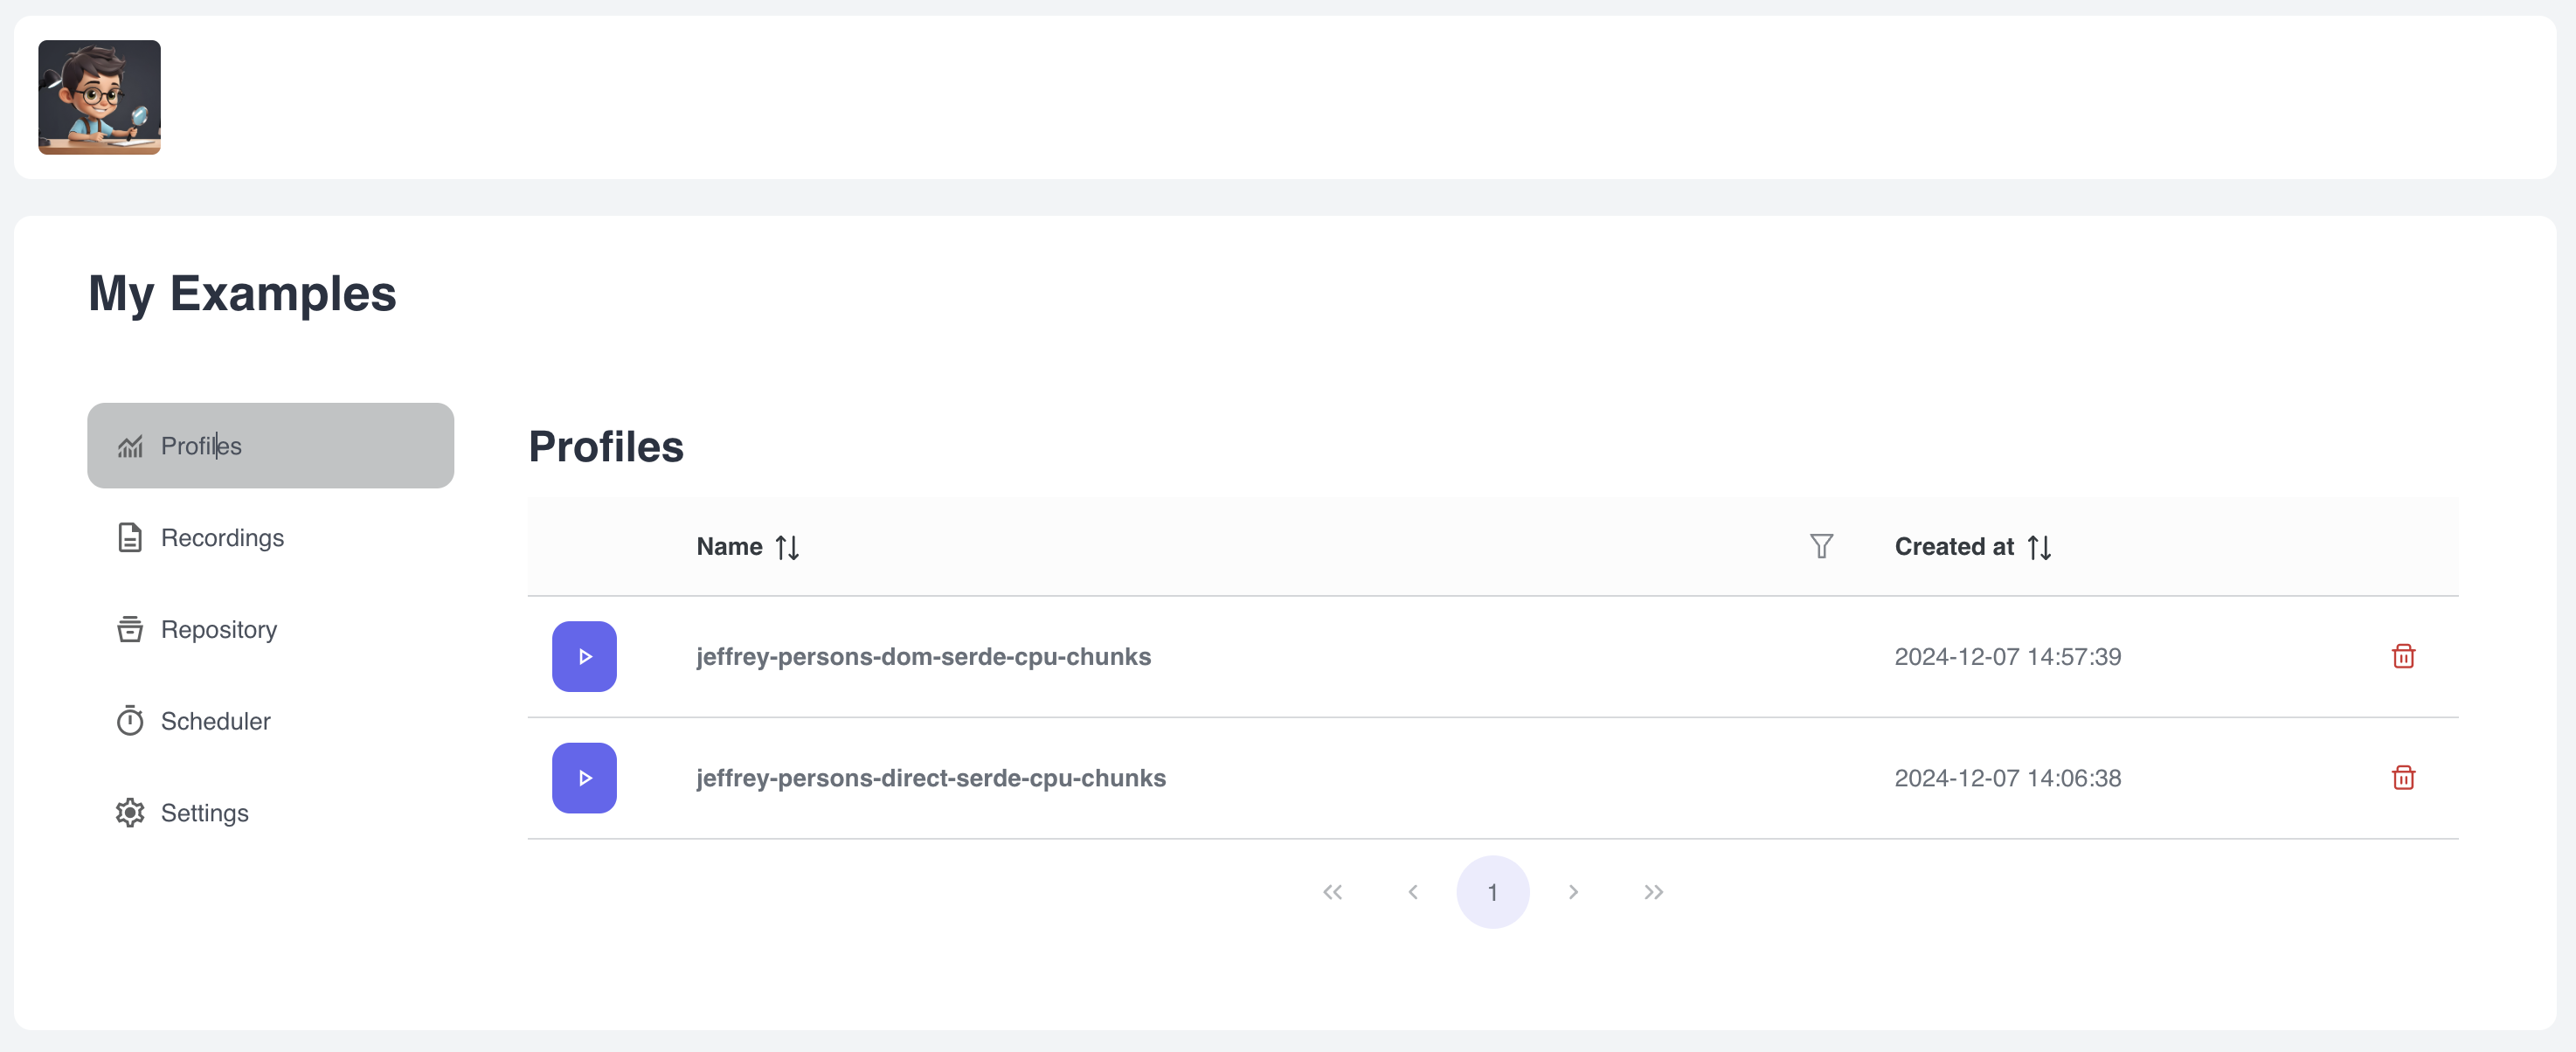
Jeffrey is now separated by Applications. Every application has its own configuration, settings and space with recordings and profiles. It’s useful to automatically connect application with actively running JVMs and JFR recordings and generates profiles belonging to the given application.

Repository
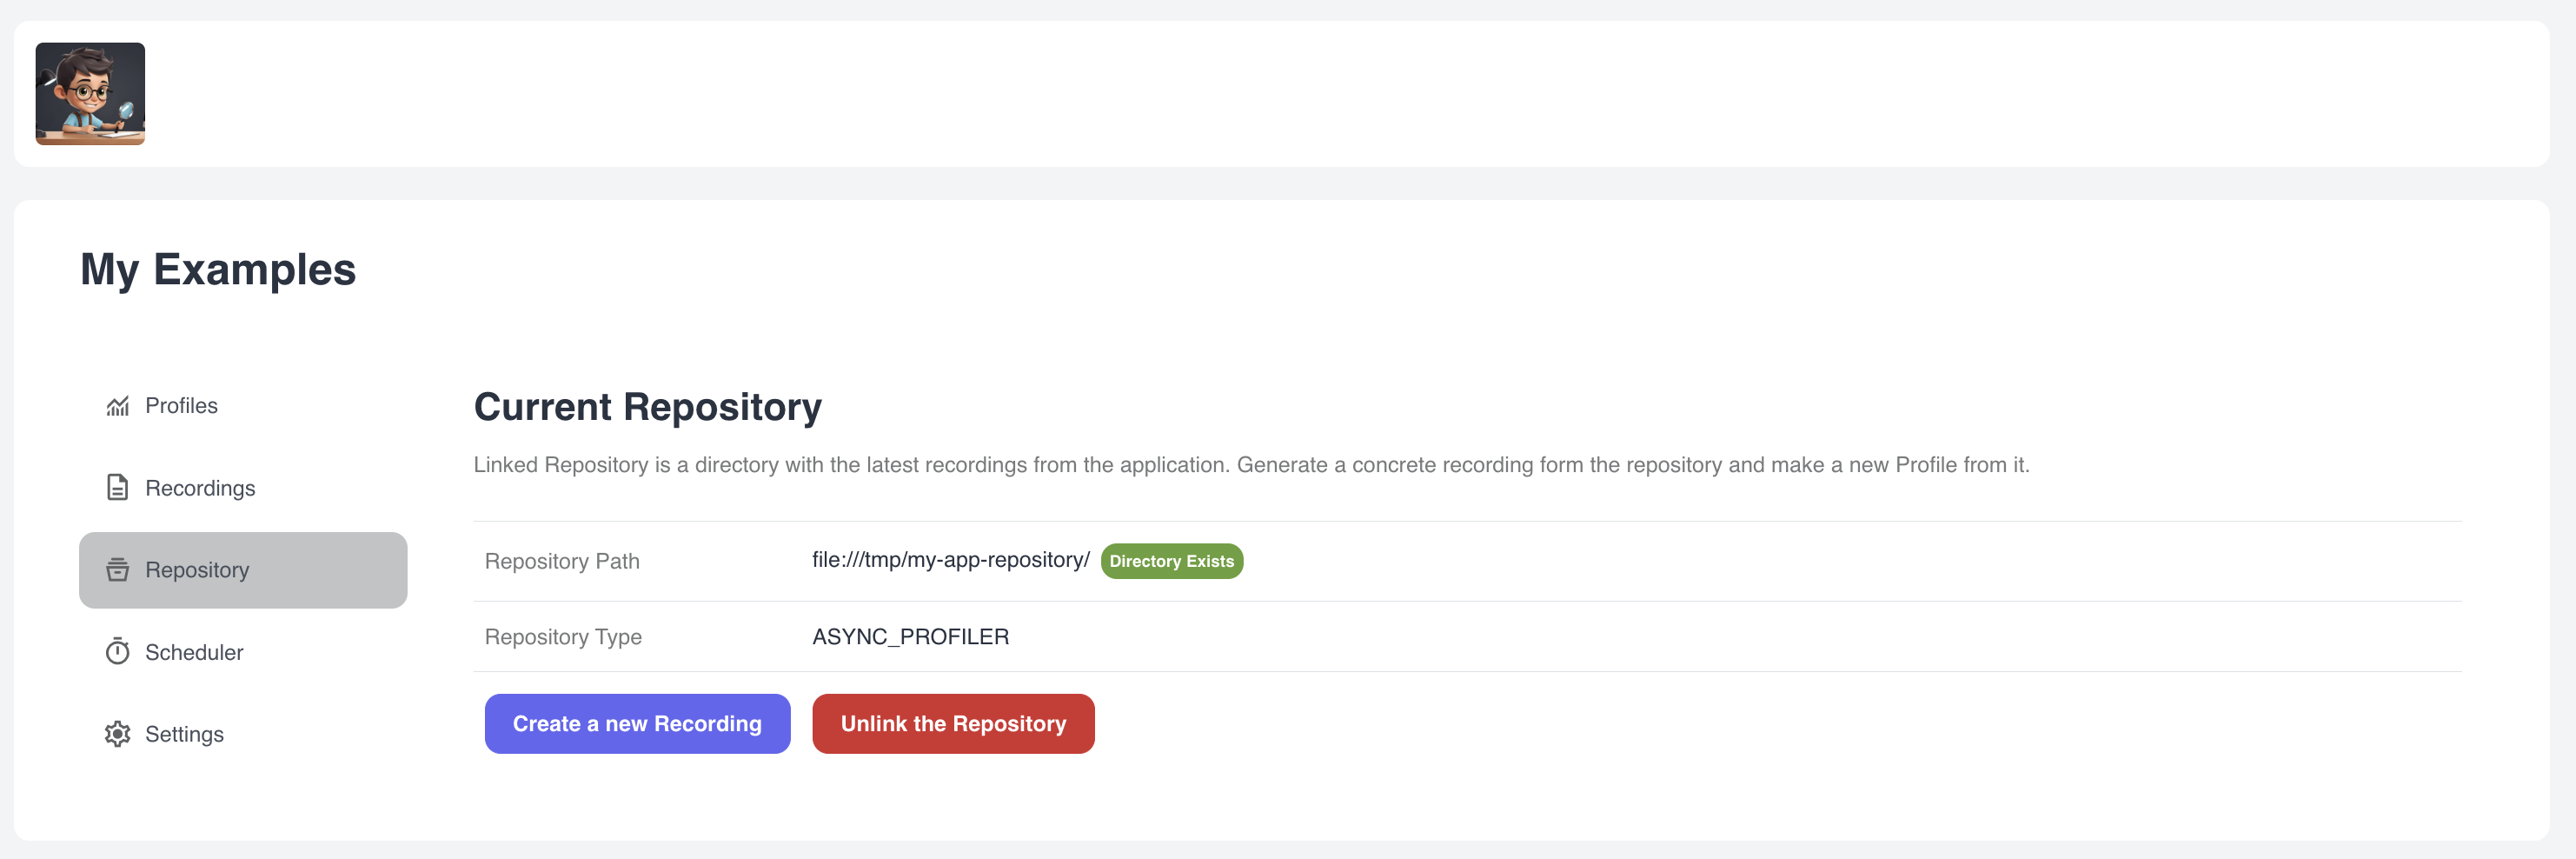
Inside the application’s space, there is a repository that contains current recordings of the single application. Currently, only Async-Profiler is supported, and we can generate recordings using the Async-Profiler configuration above.
In general, it’s a place where we can store the recordings belonging to the application, just an application’s folder.
Schedulers (Experimental)
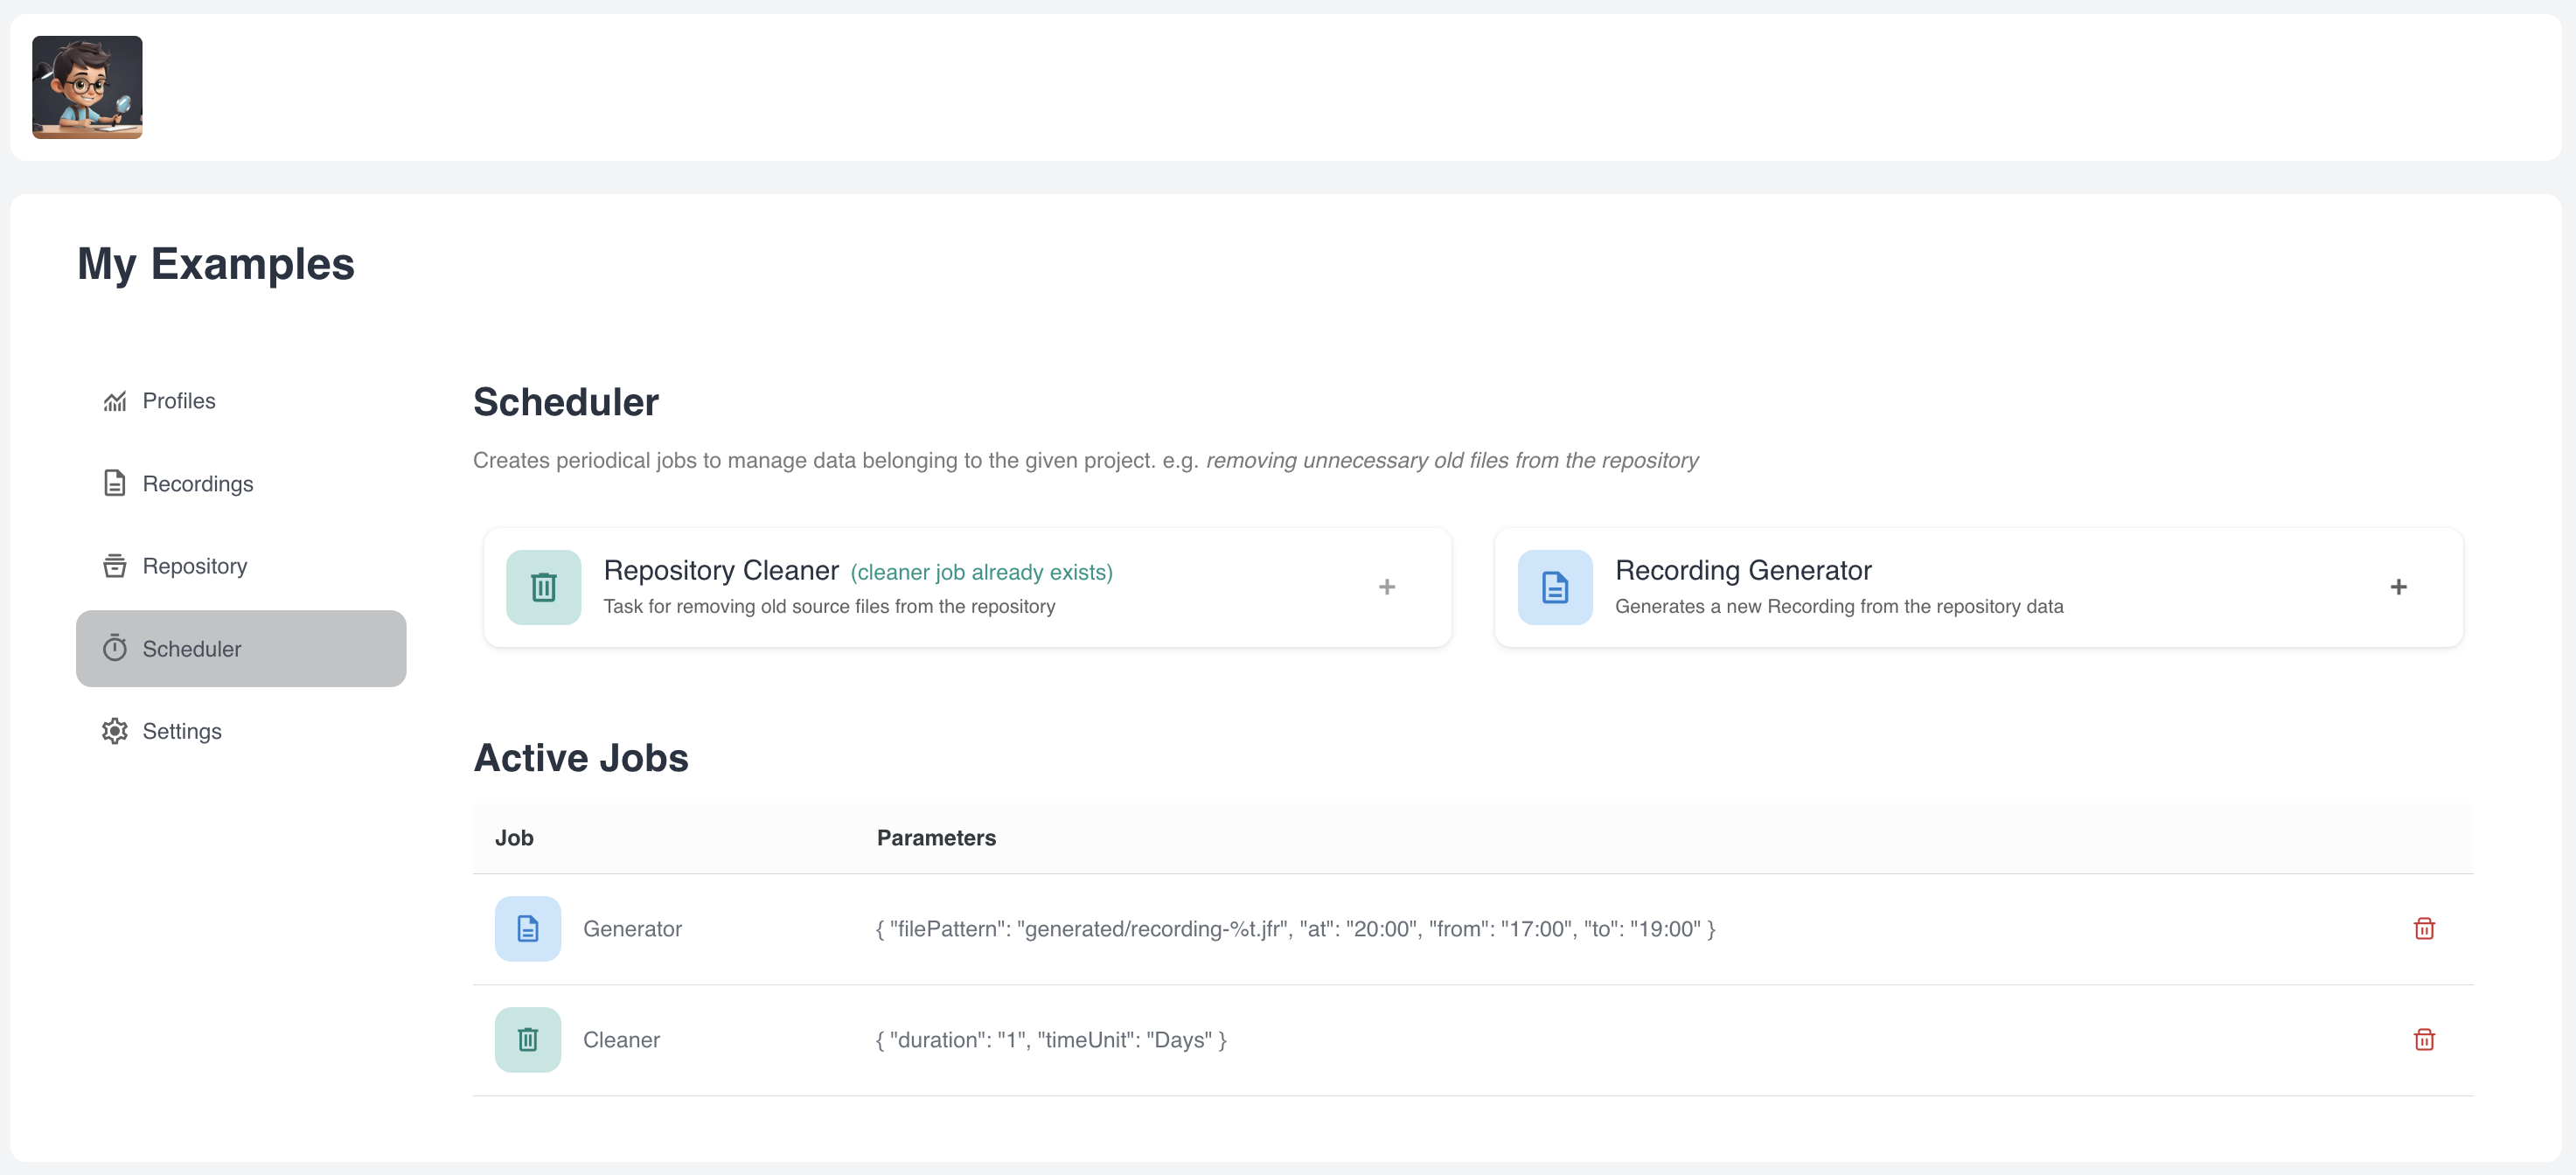
Jeffrey contains a new feature called Schedulers. It can help you create jobs that can work with the repository and automatically generates recordings every day at the same time, for the same period of time.
One use-case can be to automatically configure multiple applications in Kubernetes, connect them together with shared volume, and generate recordings every day at the same time. It can be useful for monitoring the applications in the long term. We can very easily compare the workloads of the application two days ago, and today, and see the differences in Differential Flamegraphs (differences after the new deployments?)
There is a Cleaner job that can automatically delete old recordings to save the space on the disk.
The last few words
This release brings a lot of new features and improvements. Some of them are experimental and need to be tested in the real-world scenarios. It would be great if you can try the new features and provide feedback on the GitHub repository.
This release is huge, it was caused by plenty of refactorings and improvements in the codebase. Particularly, the moving to application-based structure took a lot of time, but it was worth it. It’s now easier to maintain the application and add new features in the future.
For the next time, I would like to iterate faster and provide more frequent smaller releases.
I hope you will enjoy the new features and improvements. If you have any questions, feel free to get in touch with me :)