Let’s Get Started with Jeffrey App
Today, I’m happy to announce the 0.4 release of Jeffrey App - Jeffrey App. There is a new cool feature, let’s have a look at it!
Start the jar file using the following command:
java -jar jeffrey.jar
or you can spin up docker container with the following command, and check predefined examples.
docker run -it -p 8585:8585 petrbouda/jeffrey-examples:0.4
Open the browser: http://localhost:8585
New Features
Support for the latest Async-Profiler - Native Memory Leaks Profiling
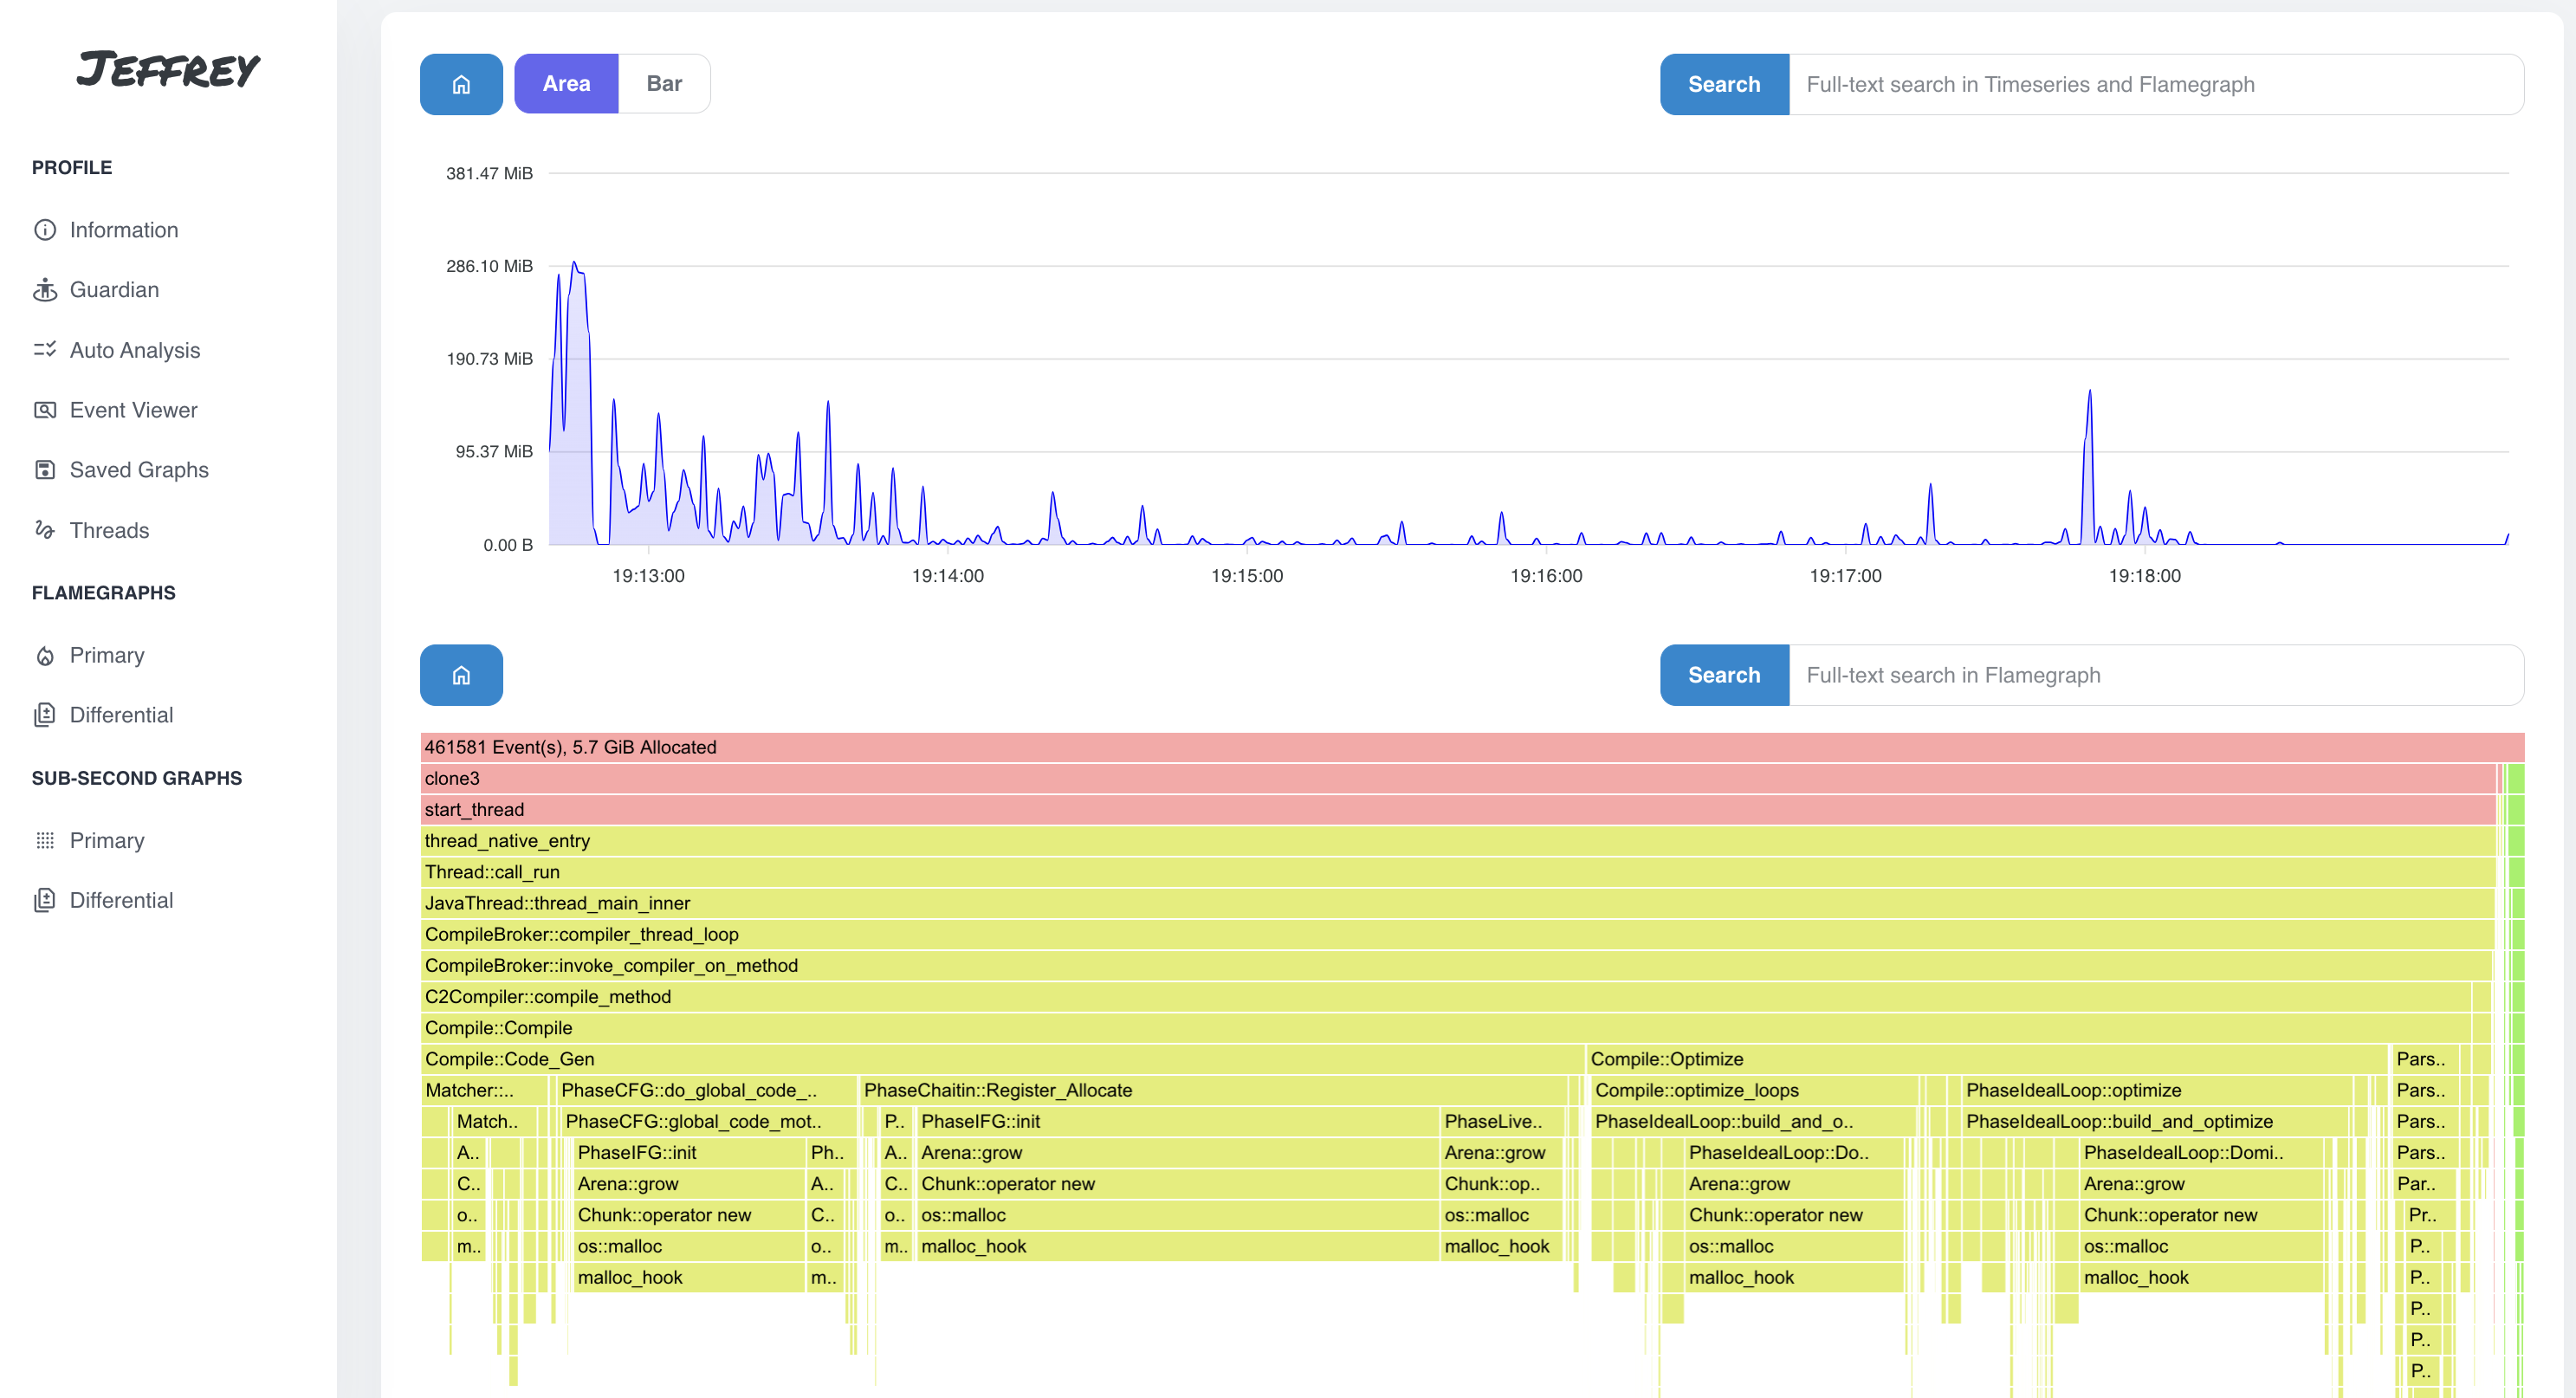
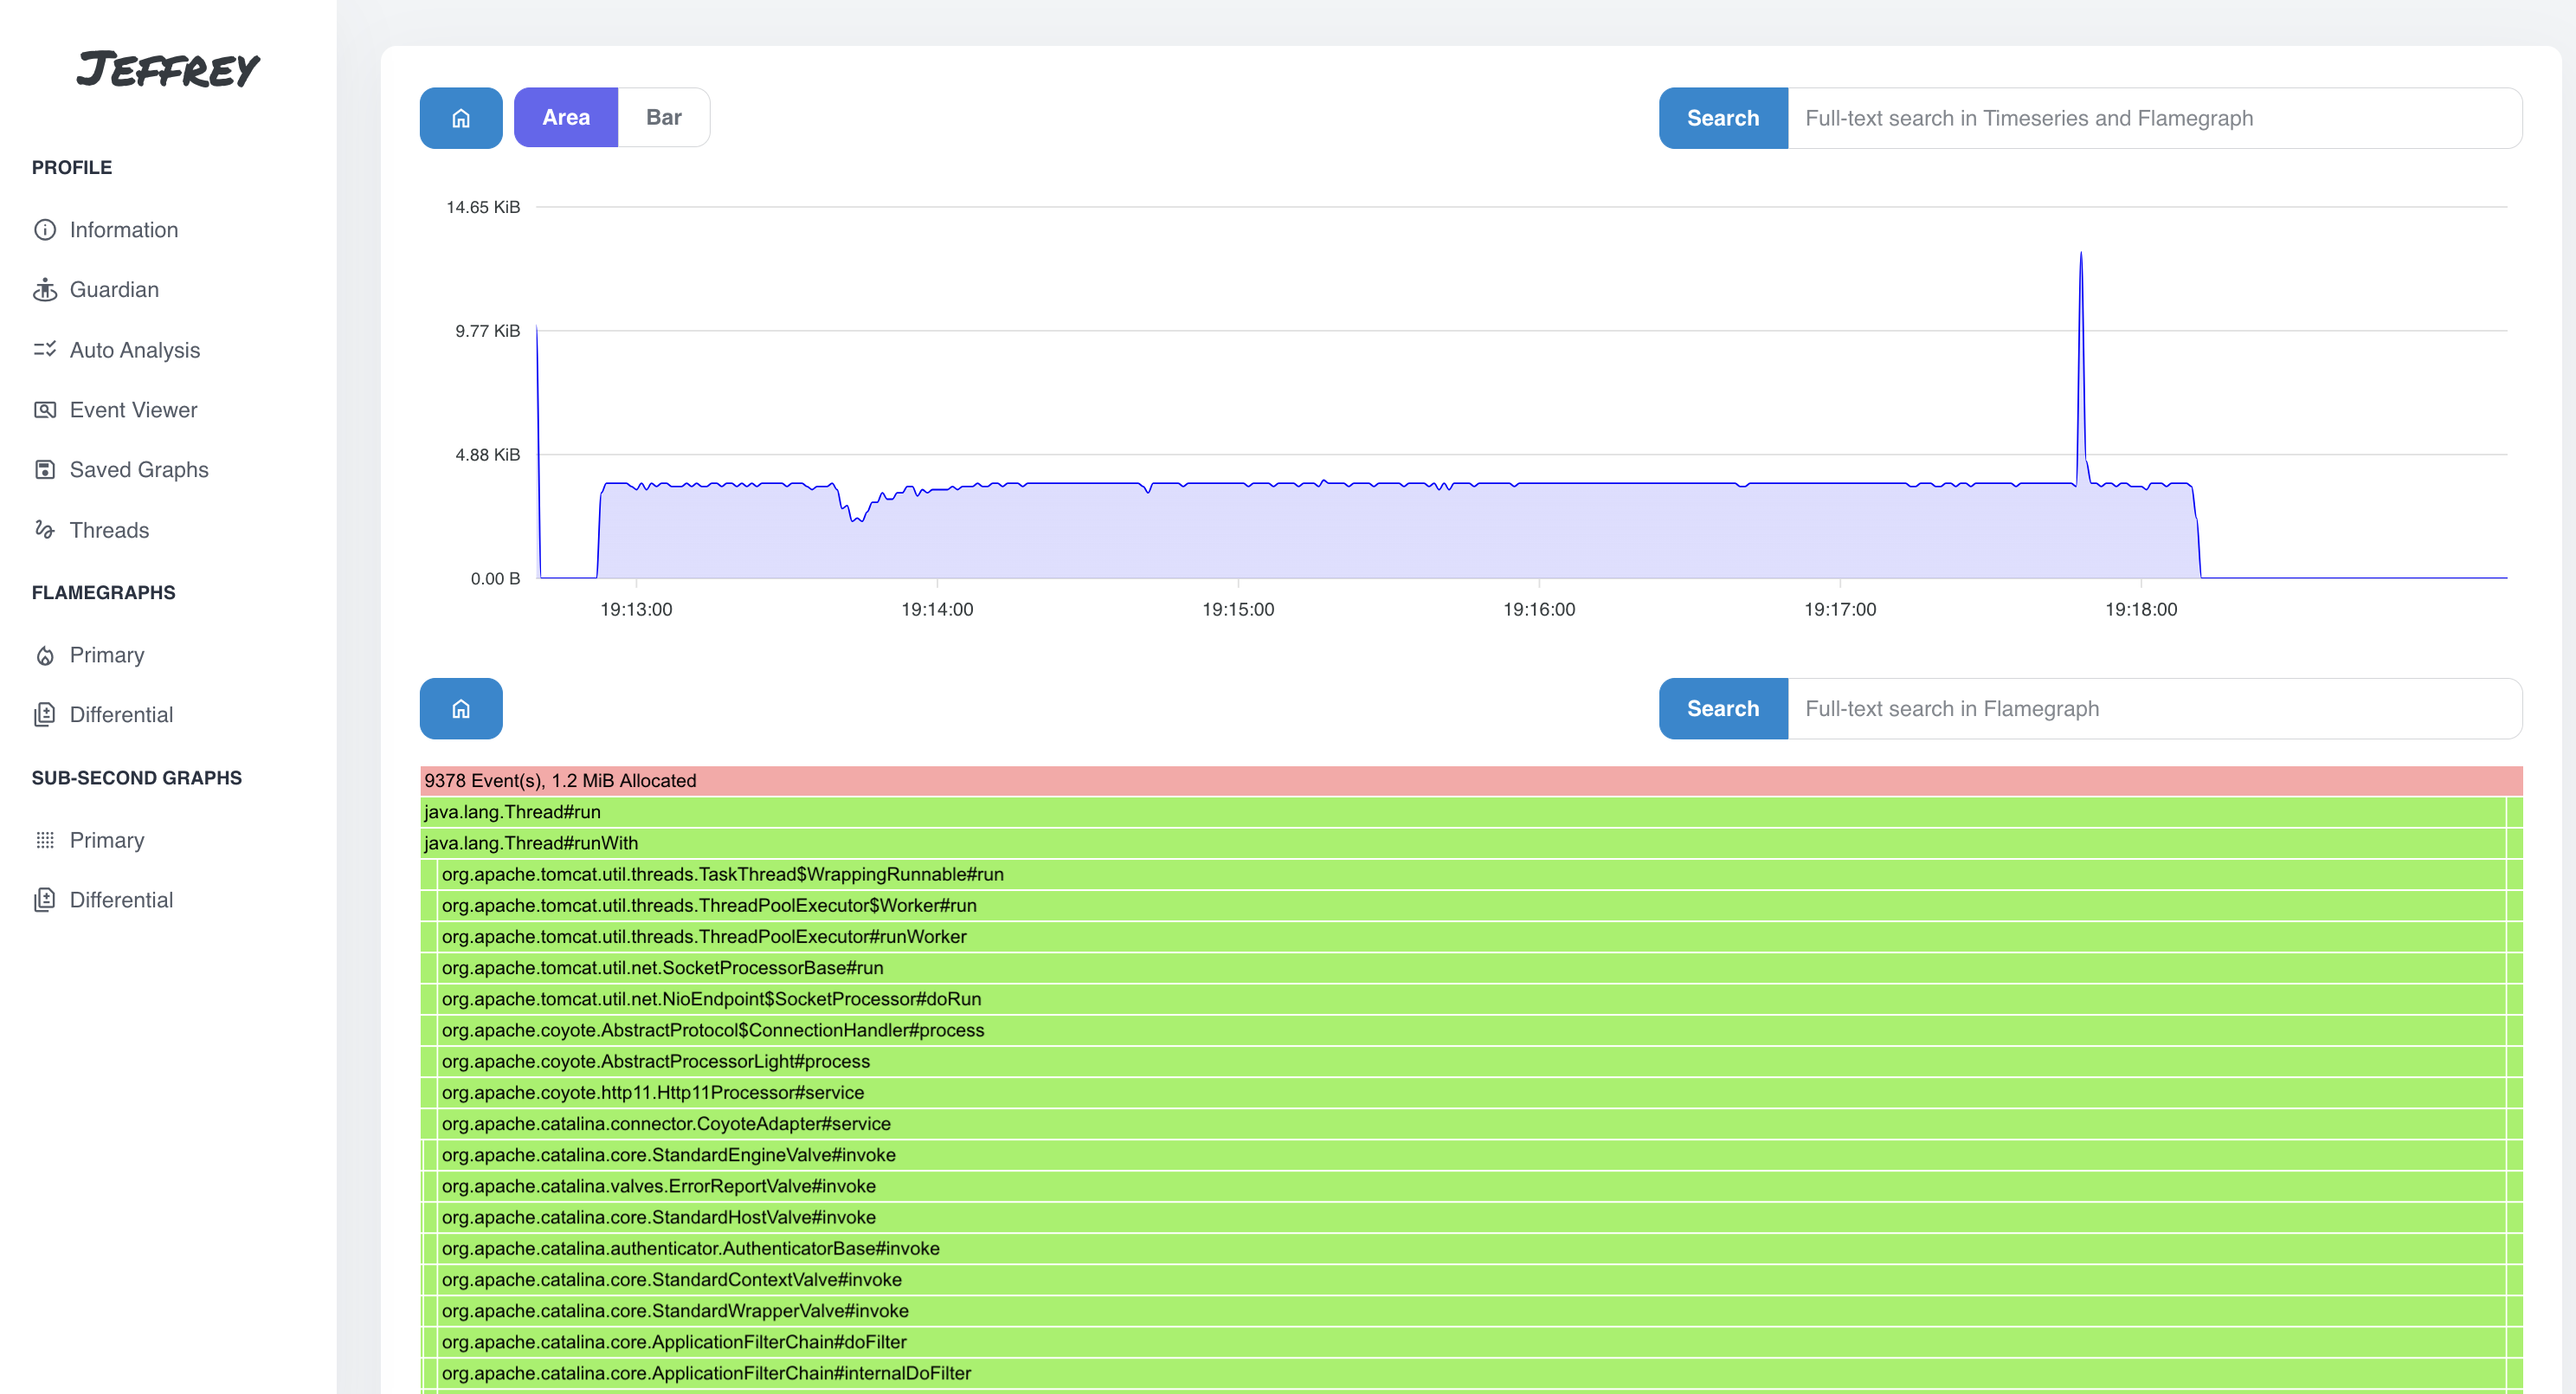
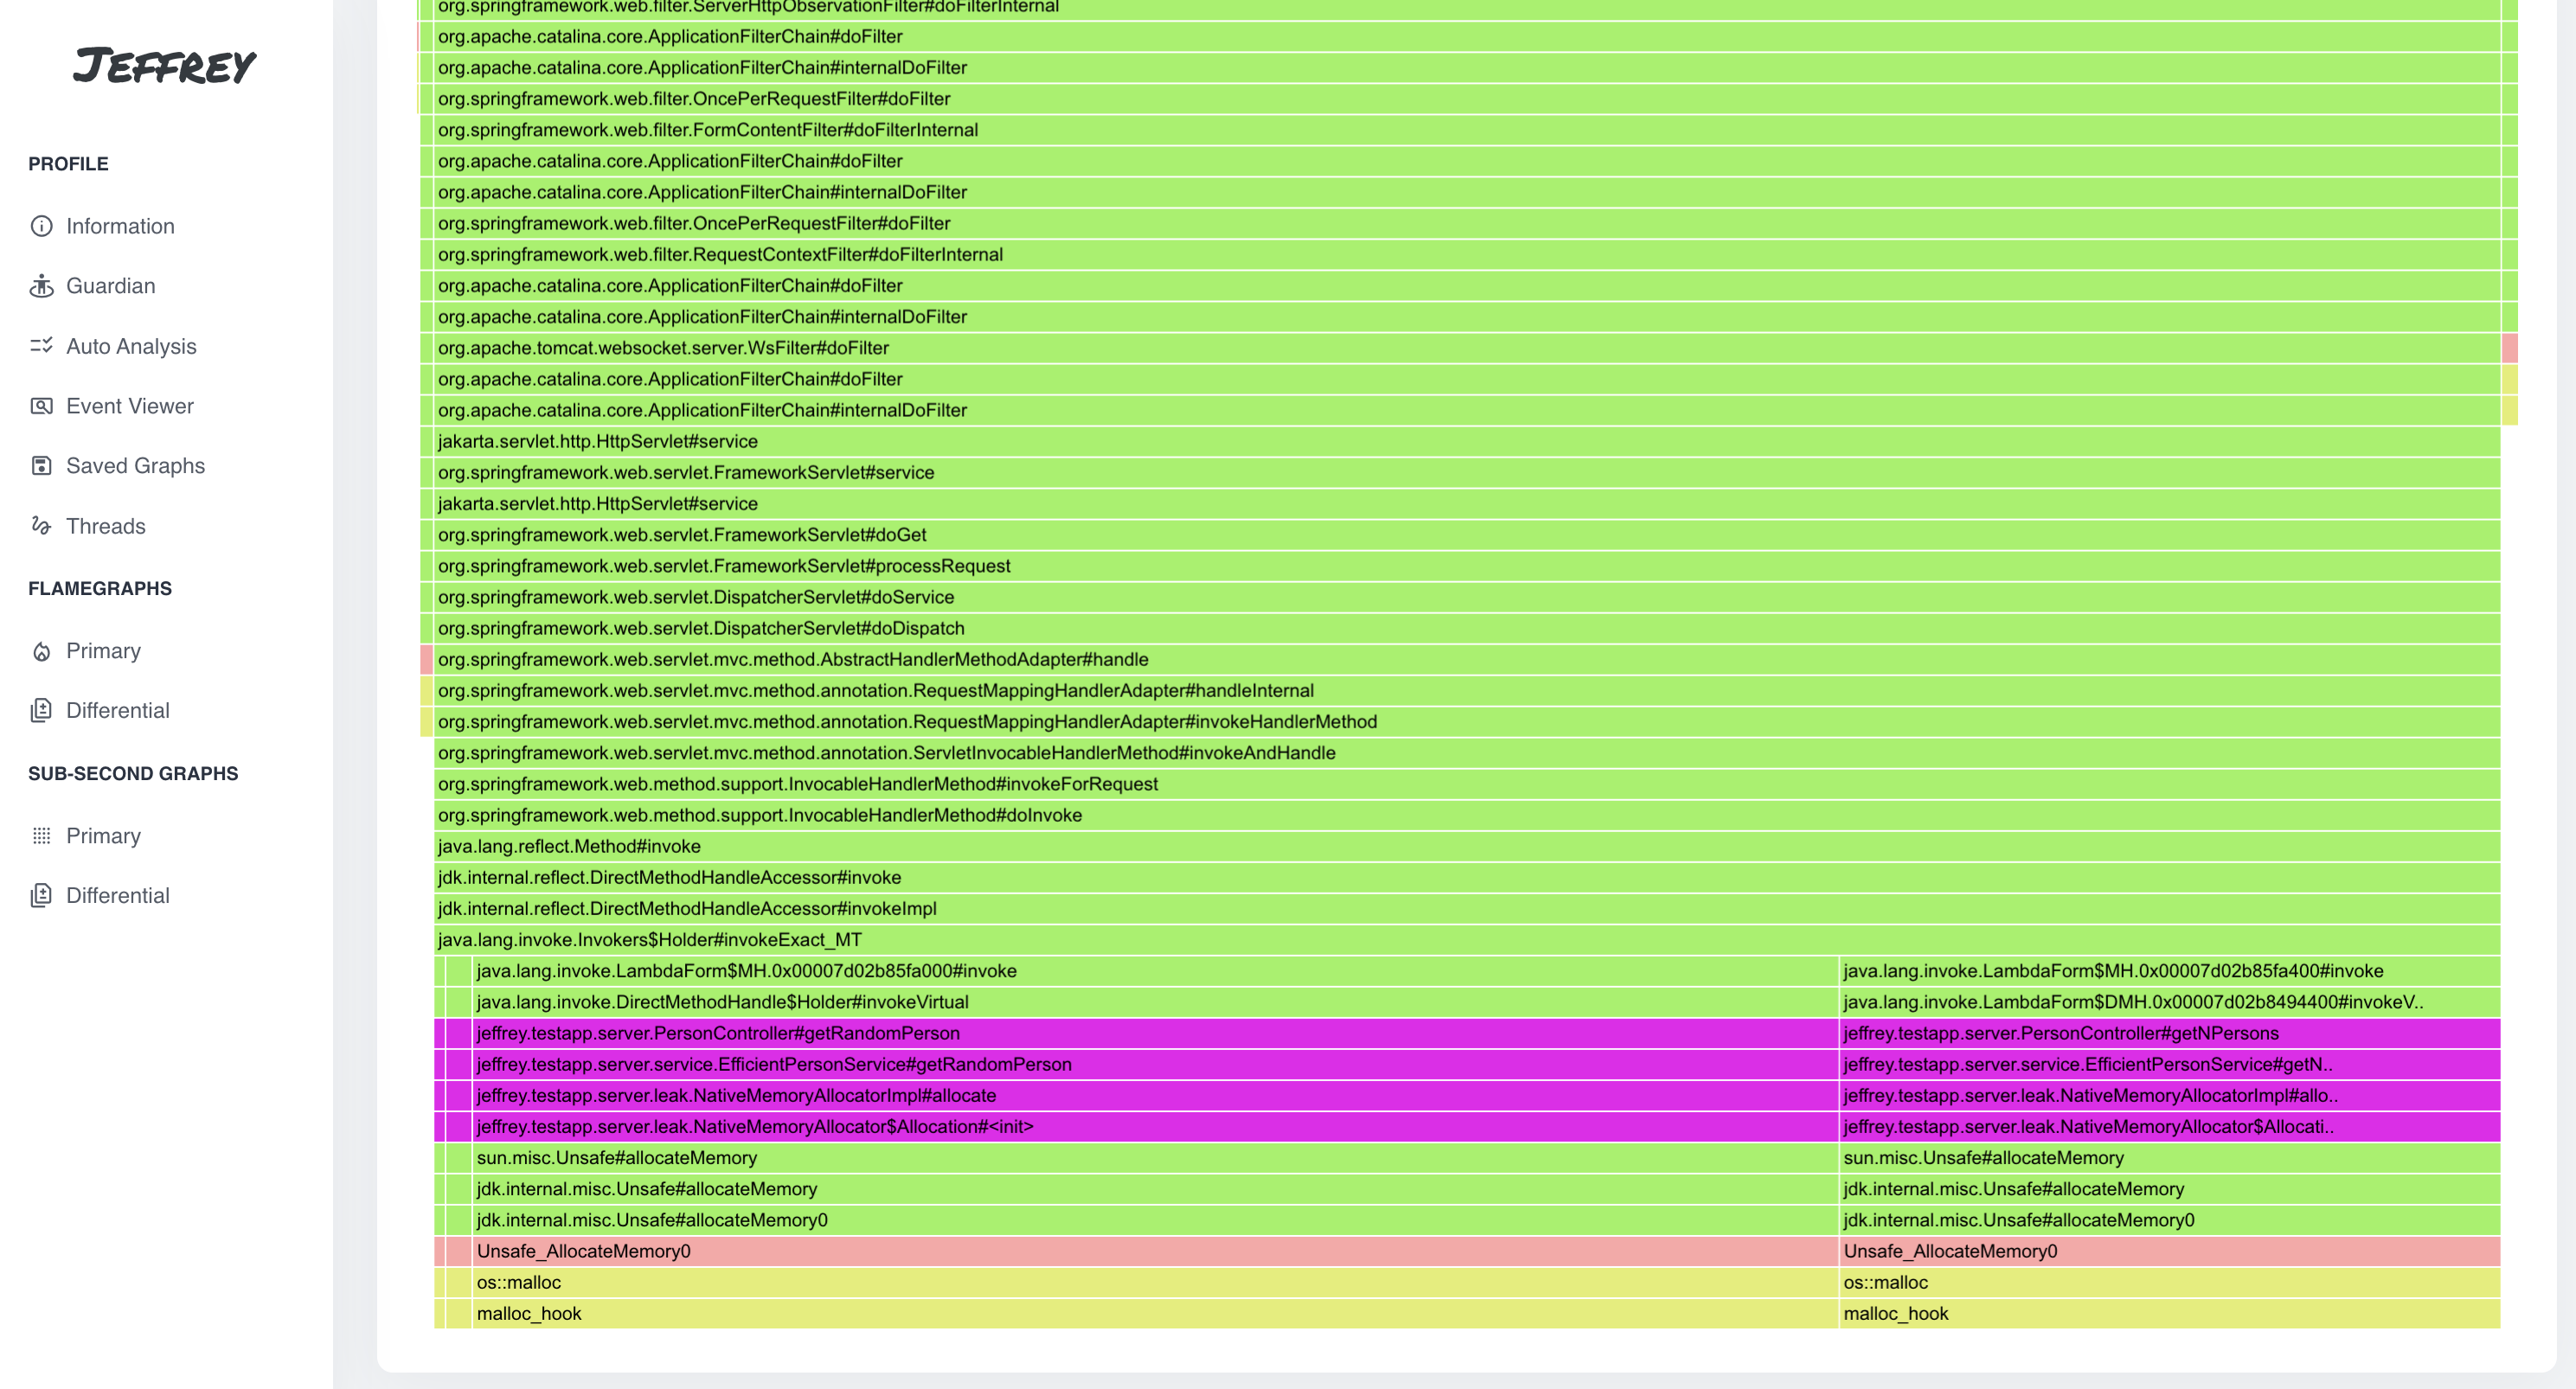
The latest versions of Async-Profiler (Nightly builds) bring a support for the Native Memory Leaks profiling. In a nutshell, it records Malloc and Free (+ their addresses) events and then Jeffrey is able to find which Malloc events have no corresponding Free events.
- use Jeffrey-examples docker image above to try the new feature
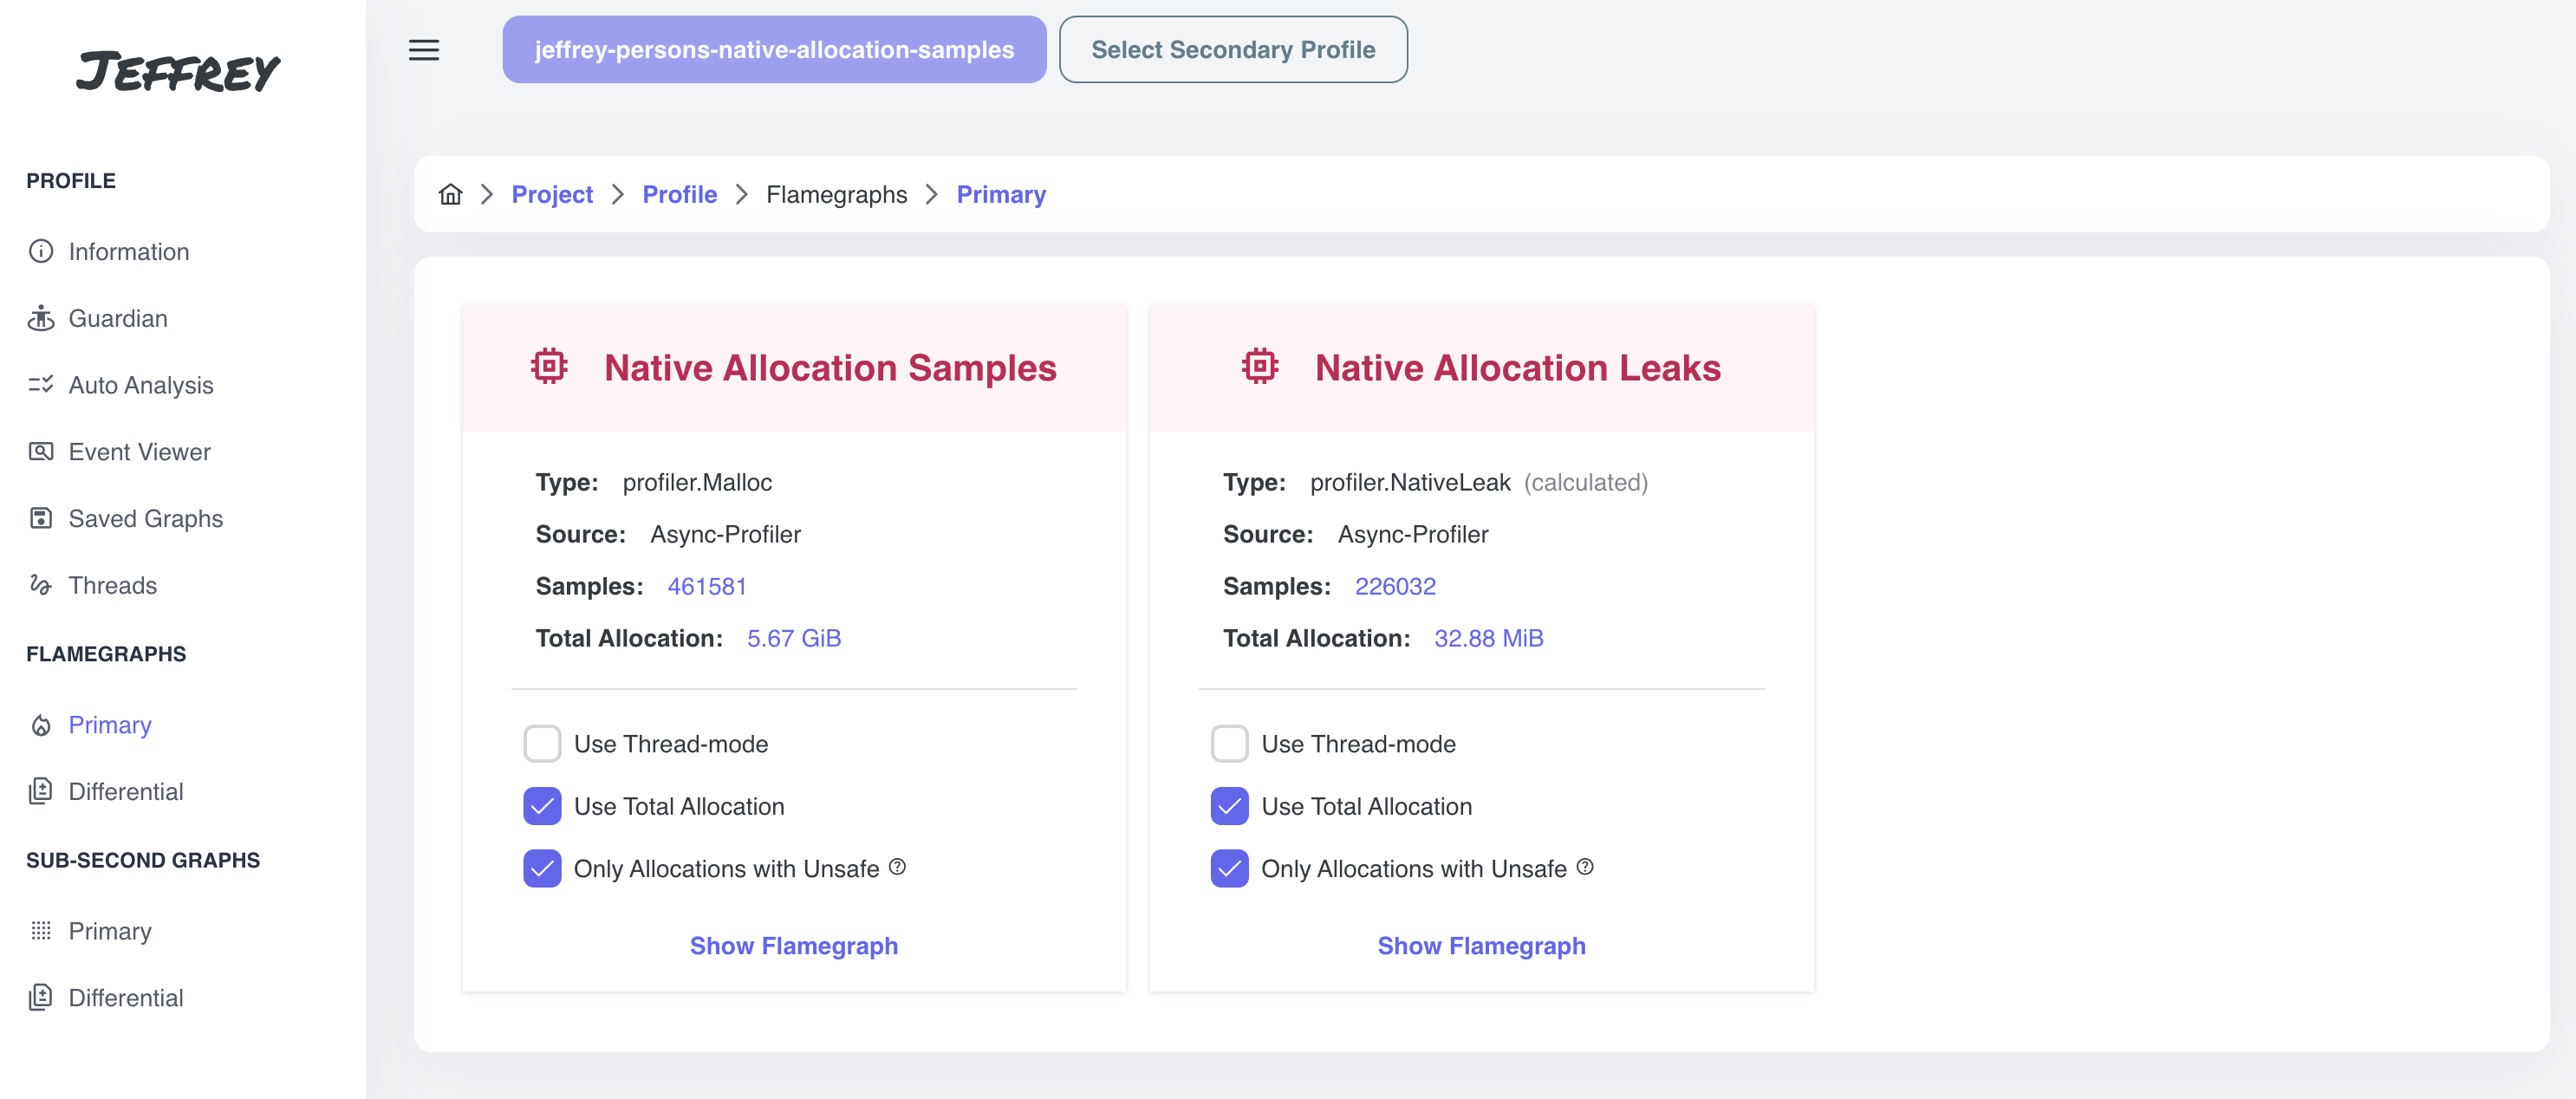
- enter to jeffrey-persons-native-allocation-samples profile and navigate to predefined flamegraphs: Flamegraphs -> Primary


- there is a new option: Only Allocations with Unsafe, it takes into account only samples that are allocated using Unsafe
- opt out the option if you want to see all Malloc allocations, or all Malloc allocations without corresponding Free events


Multi-platform release of Docker Images
We finally support ARM-based platform for docker images as well, you can enjoy Jeffrey on your Mac Silicon.
The last few words
I hope you will enjoy the new features and improvements. If you have any questions, feel free to get in touch with me :)