Let’s Get Started with Jeffrey CLI (Command-Line Interface)
To make Jeffrey more accessible and easier to use, I decided to offer not only GUI interface (Jeffrey App), but even Command-Line Tool for generating graphs. From the version 0.2, users are able to generate Flamegraphs and Sub-second Graphs from their JFR recordings using a single command from their terminals. Moreover, the graphs and data are included into a single HTML file, therefore, you have a very convenient way to share it with your colleagues.
However, there are also some limitations over the typical server-based solution Jeffrey App coming from the “static nature” of the generated file. Jeffrey App dynamically generates some data on the server behind the scene. Therefore, these features are not available in CLI solution. However, there are some mitigations of these shortcomings:
- Dynamic searching in Timeseries Graph is not provided. We can use CLI parameter to split the timeseries graph at the time of executing the command.
- Zooming of Timeseries graph is not propagated to the Flamegraph
- Sub-second Graph cannot automatically generate a Flamegraph. However, it provides a command to generate it from your terminal.
Download and Startup
The most straightforward way is to download it directly from Github: Jeffrey CLI.
I’ll be using pre-generated recordings from the Jeffrey’s Test Application. More information about the application and the workload can be found here: Quick Start with Examples. Checkout the recordings https://github.com/petrbouda/jeffrey-recordings and copy the jeffrey-cli.jar to the same folder to make easier and shorter commands.
First steps
jeffrey-cli.jar is executable jar file that executes basic commands with some arguments to specify the behavior.
$ java -jar jeffrey-cli.jar --version
0.2

$ java -jar jeffrey-cli.jar --help
Usage:  [-hV] [COMMAND]
Generates a flamegraph according to the selected event-type
  -h, --help      Show this help message and exit.
  -V, --version   Print version information and exit.
Commands:
  flame            Generates a Flamegraph (default: jdk.ExecutionSample)
  flame-diff       Generates a Differential Flamegraph (default: jdk.ExecutionSample)
  events           List all event-types containing a stacktrace for building a flamegraph
  sub-second       Generates Sub-Second graph (the first 5 minutes)
  sub-second-diff  Generates Differential Sub-Second graph (the first 5 minutes)
According to HELP command, at the time of writing this blog post, we can generate Flamegraphs, Sub-seconds and their Diff versions.
Generate Flamegraphs
$ java -jar jeffrey-cli.jar flame --help
Usage:  flame [-htVw] [--with-timeseries] [-e=<eventType>] [--end-time=<endTime>] [-o=<outputFile>] [-s=<searchPattern>] [--start-time=<startTime>] <jfr_file>
Generates a Flamegraph (default: jdk.ExecutionSample)
      <jfr_file>             one JFR file for fetching events
  -e, --event-type=<eventType>
                             Selects events for generating a flamegraph (e.g. jdk.ExecutionSample)
      --end-time=<endTime>   Relative end in milliseconds from the beginning of the JFR file
  -h, --help                 Show this help message and exit.
  -o, --output=<outputFile>  Path to the file with the generated flamegraph (default is the current folder with a filename '<jfr-name>.html')
  -s, --search-pattern=<searchPattern>
                             Only for timeseries (timeseries cannot dynamically searches in the generated file, only the flamegraph can)
      --start-time=<startTime>
                             Relative start in milliseconds from the beginning of the JFR file
  -t, --thread               Groups stacktraces omitted on the particular thread
  -V, --version              Print version information and exit.
  -w, --weight               Uses event's weight instead of # of samples (currently supported: jdk.ObjectAllocationSample, jdk.ObjectAllocationInNewTLAB, jdk.
                               ObjectAllocationOutsideTLAB, jdk.ThreadPark, jdk.JavaMonitorWait, jdk.JavaMonitorEnter)
      --with-timeseries      Includes Timeseries graph with a Flamegraph (it's `true` by default, set `false` to have only the Flamegraph)
There are multiple arguments to clarify the generated output, let’s focus on the main ones.
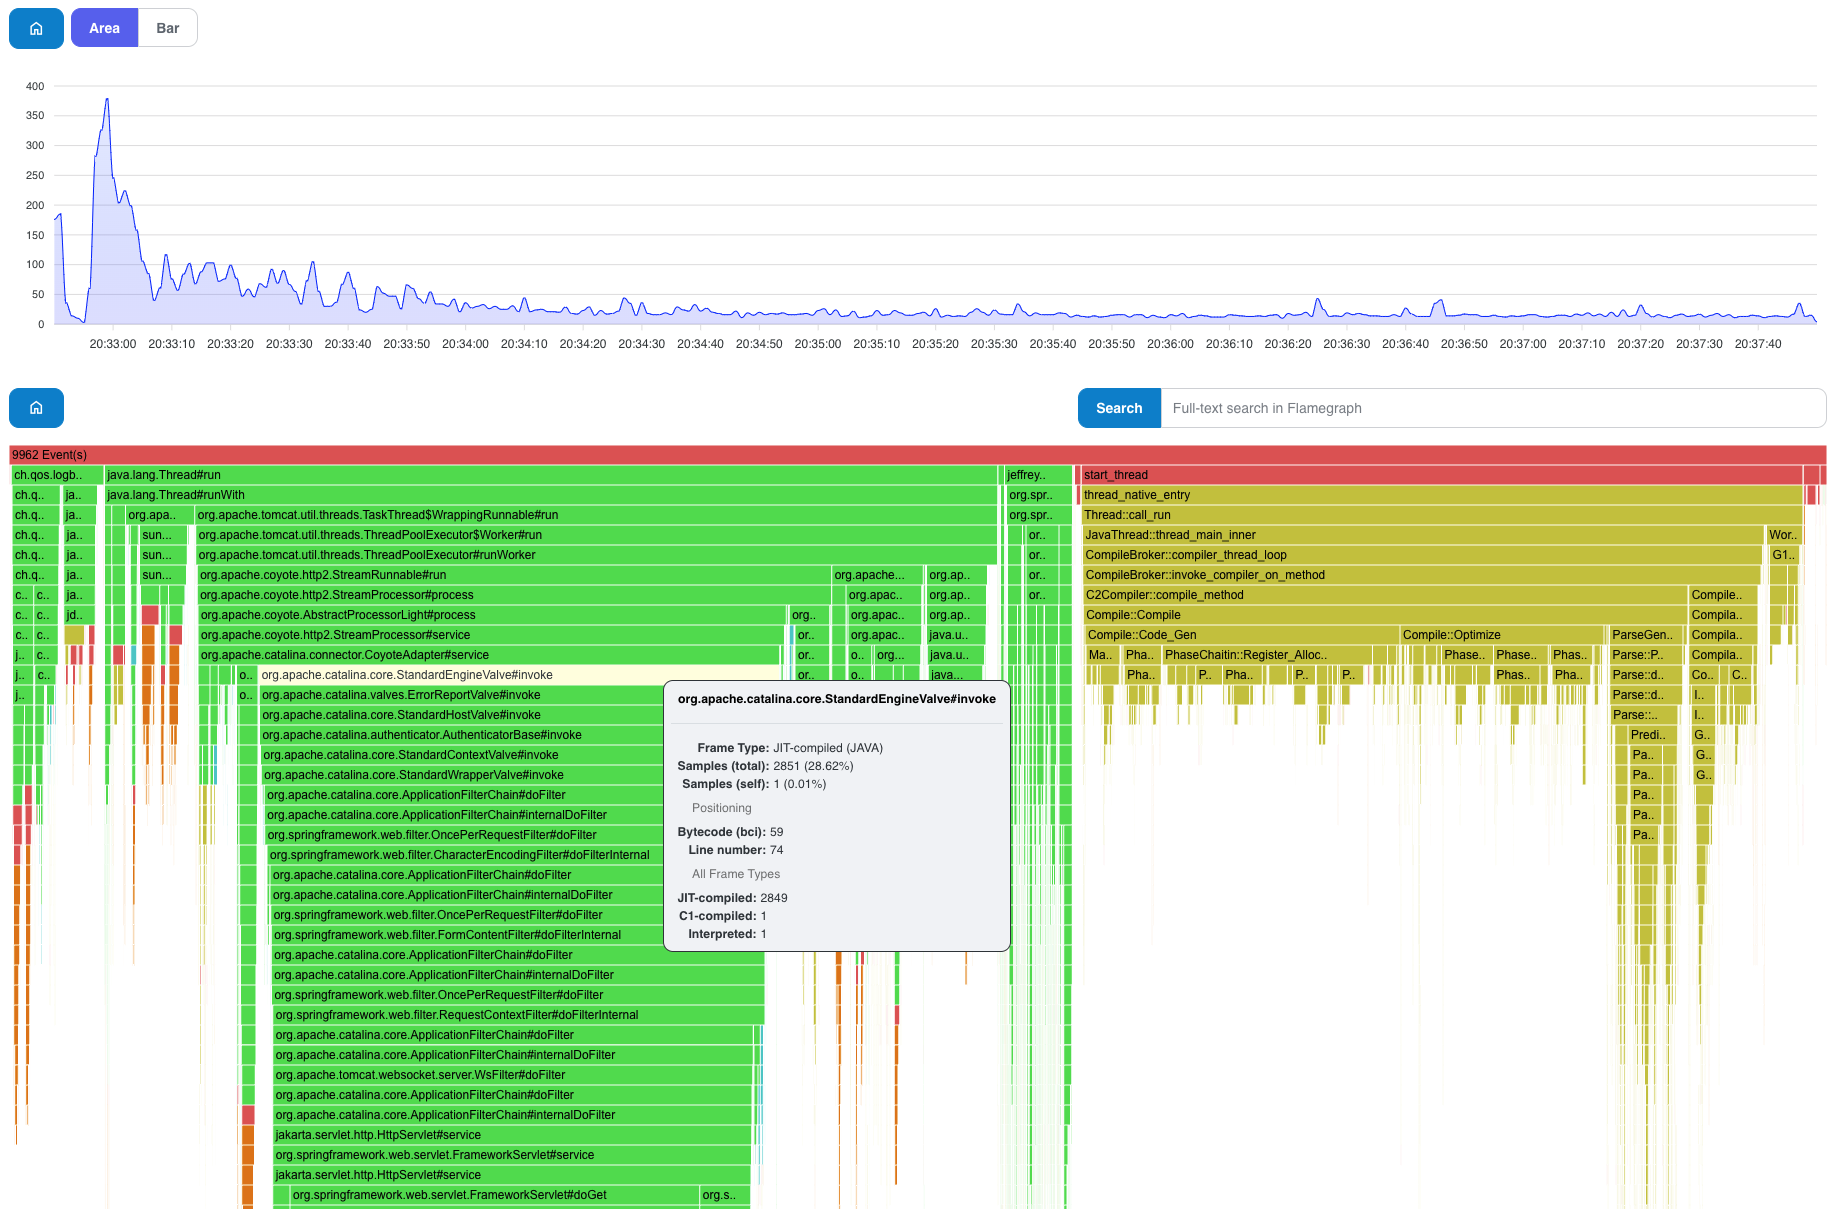
java -jar jeffrey-cli.jar flame jeffrey-persons-full-direct-serde.jfr
Generated: <path>/jeffrey-recordings/jeffrey-persons-full-direct-serde.html
The simplest command above generate the CPU flamegraph (based on jdk.ExecutionSample) to the same folder with the name of the recording (you can use output argument to specify the output’s filename and path)
Specific event-type with the weight instead of a number of samples
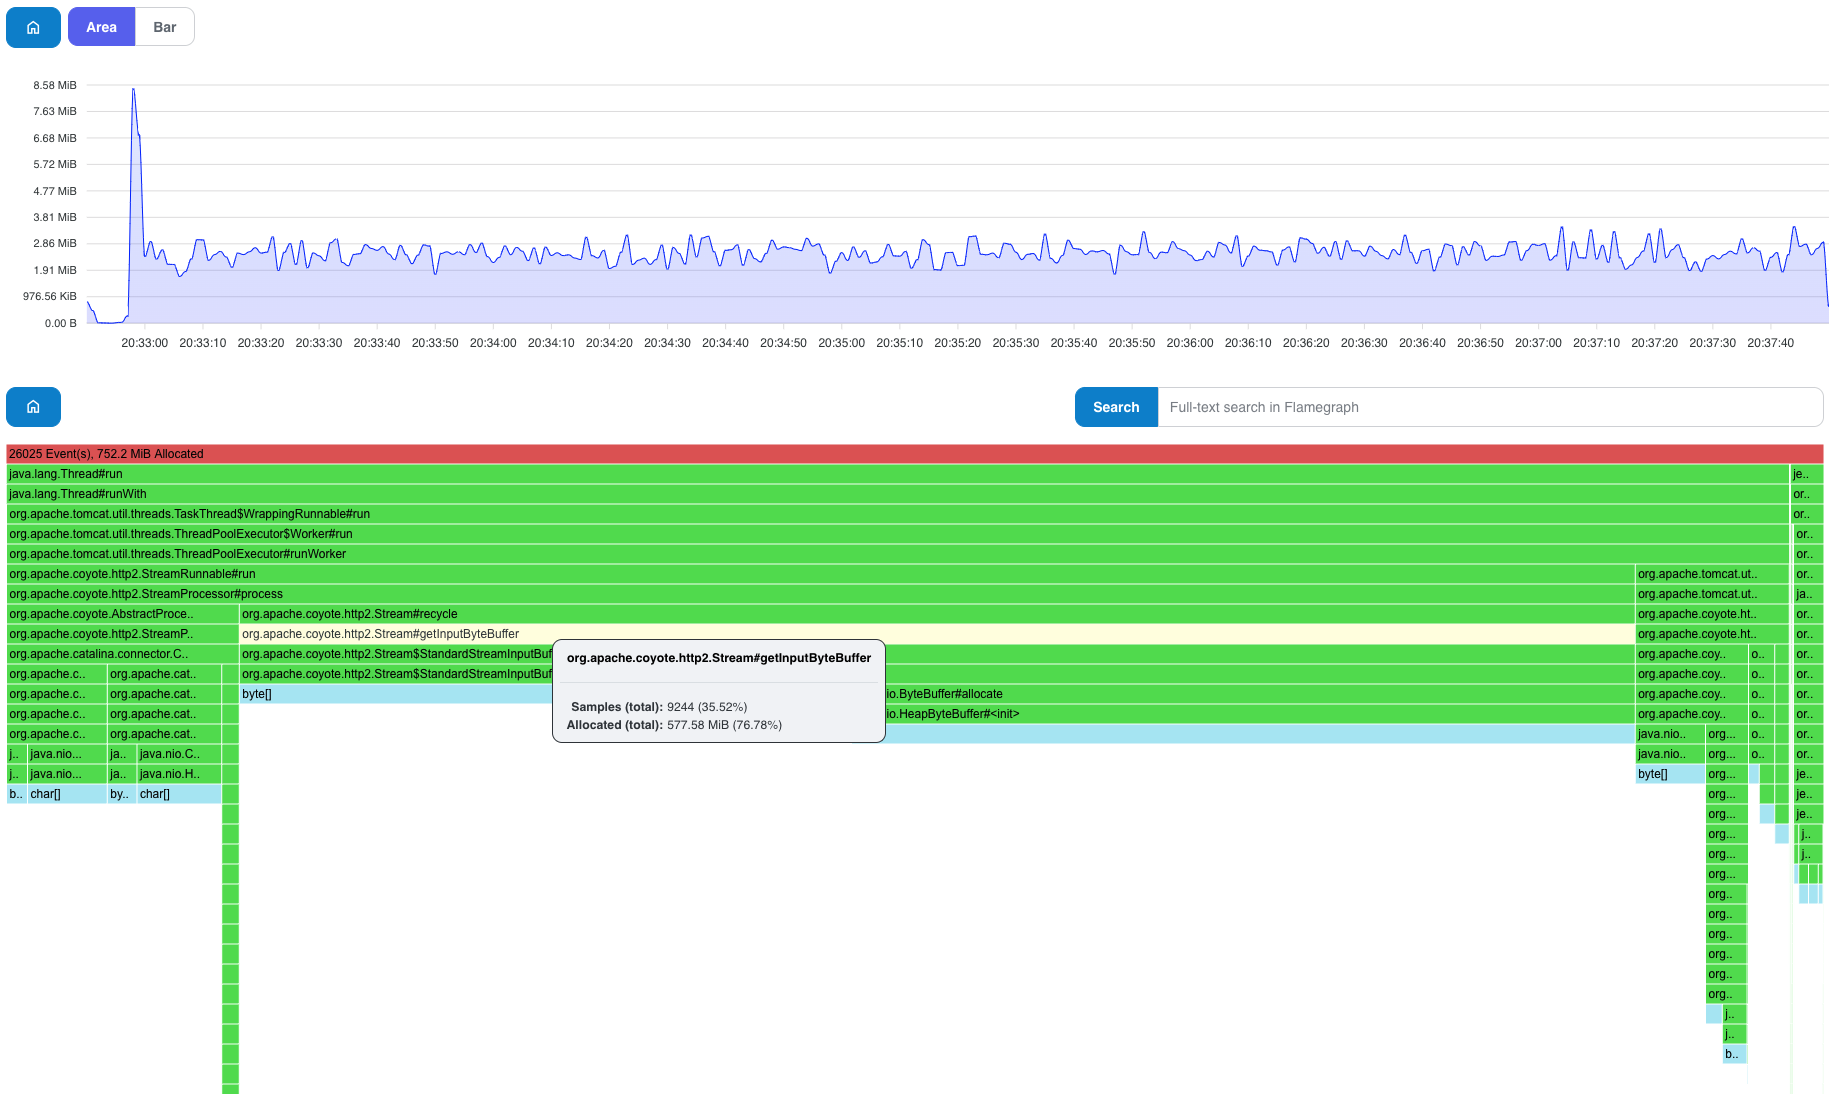
Another example below uses a specific event-type with a weight option. Since we know that the recording was generated using Async-Profiler with alloc option, then we need to use jdk.ObjectAllocationInNewTLAB as the event-type to get the appropriate result.
weight option is useful in this case because we want to be focused more on the path generating more bytes instead of more samples. Otherwise, we could be misled by a lot of samples with non-significant allocated amount of memory that would hide interesting spots with fewer samples but huge allocated chunks.
$ java -jar jeffrey-cli.jar flame --event-type=jdk.ObjectAllocationInNewTLAB --weight jeffrey-persons-full-direct-serde.jfr
Generated: <path>/jeffrey-recordings/jeffrey-persons-full-direct-serde.html
Group the samples by threads
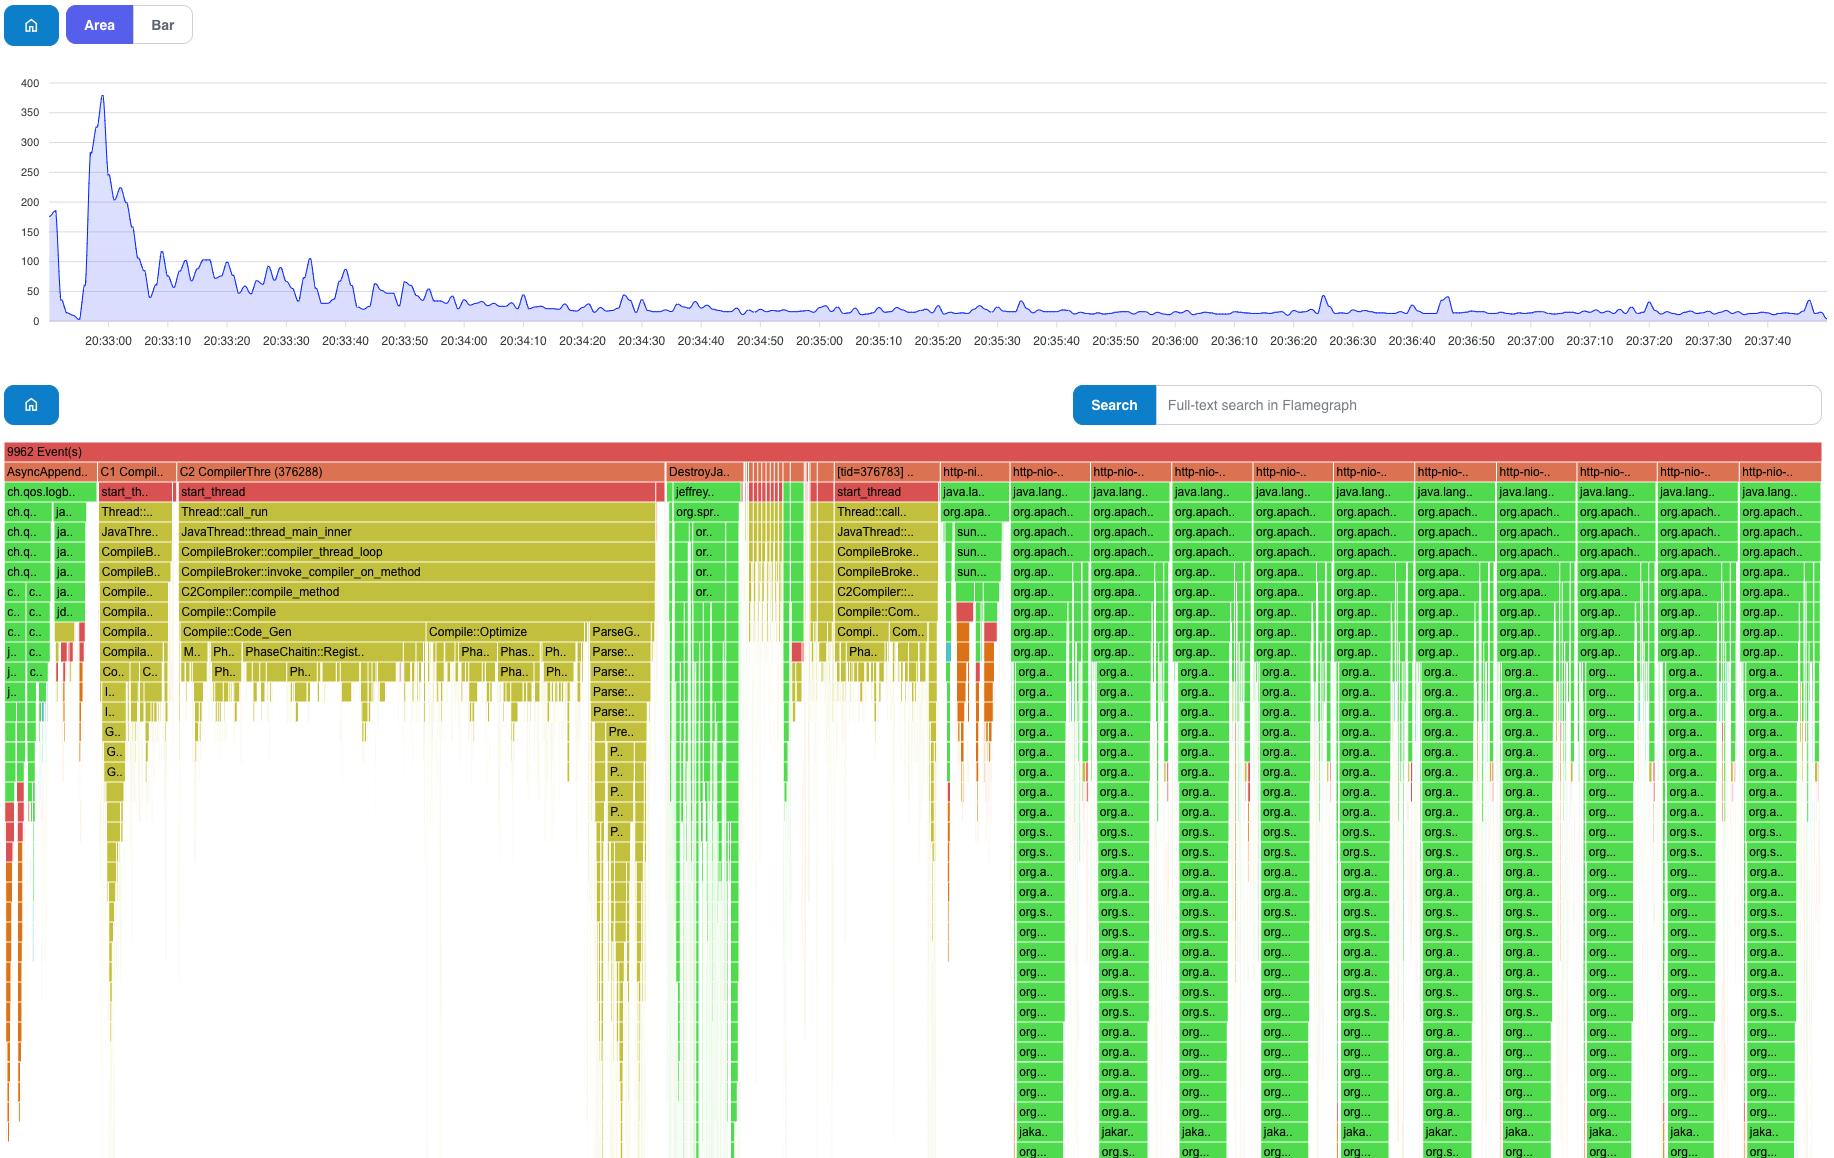
In some cases, it’s useful to generate a graph where samples are grouped by a specific thread generated the given sample (especially for wall-clock samples, however, it makes sense for other types as well).
$ java -jar jeffrey-cli.jar flame --thread jeffrey-persons-full-direct-serde.jfr
Generated: <path>/jeffrey-recordings/jeffrey-persons-full-direct-serde.html
Searching in Timeseries and Flamegraph
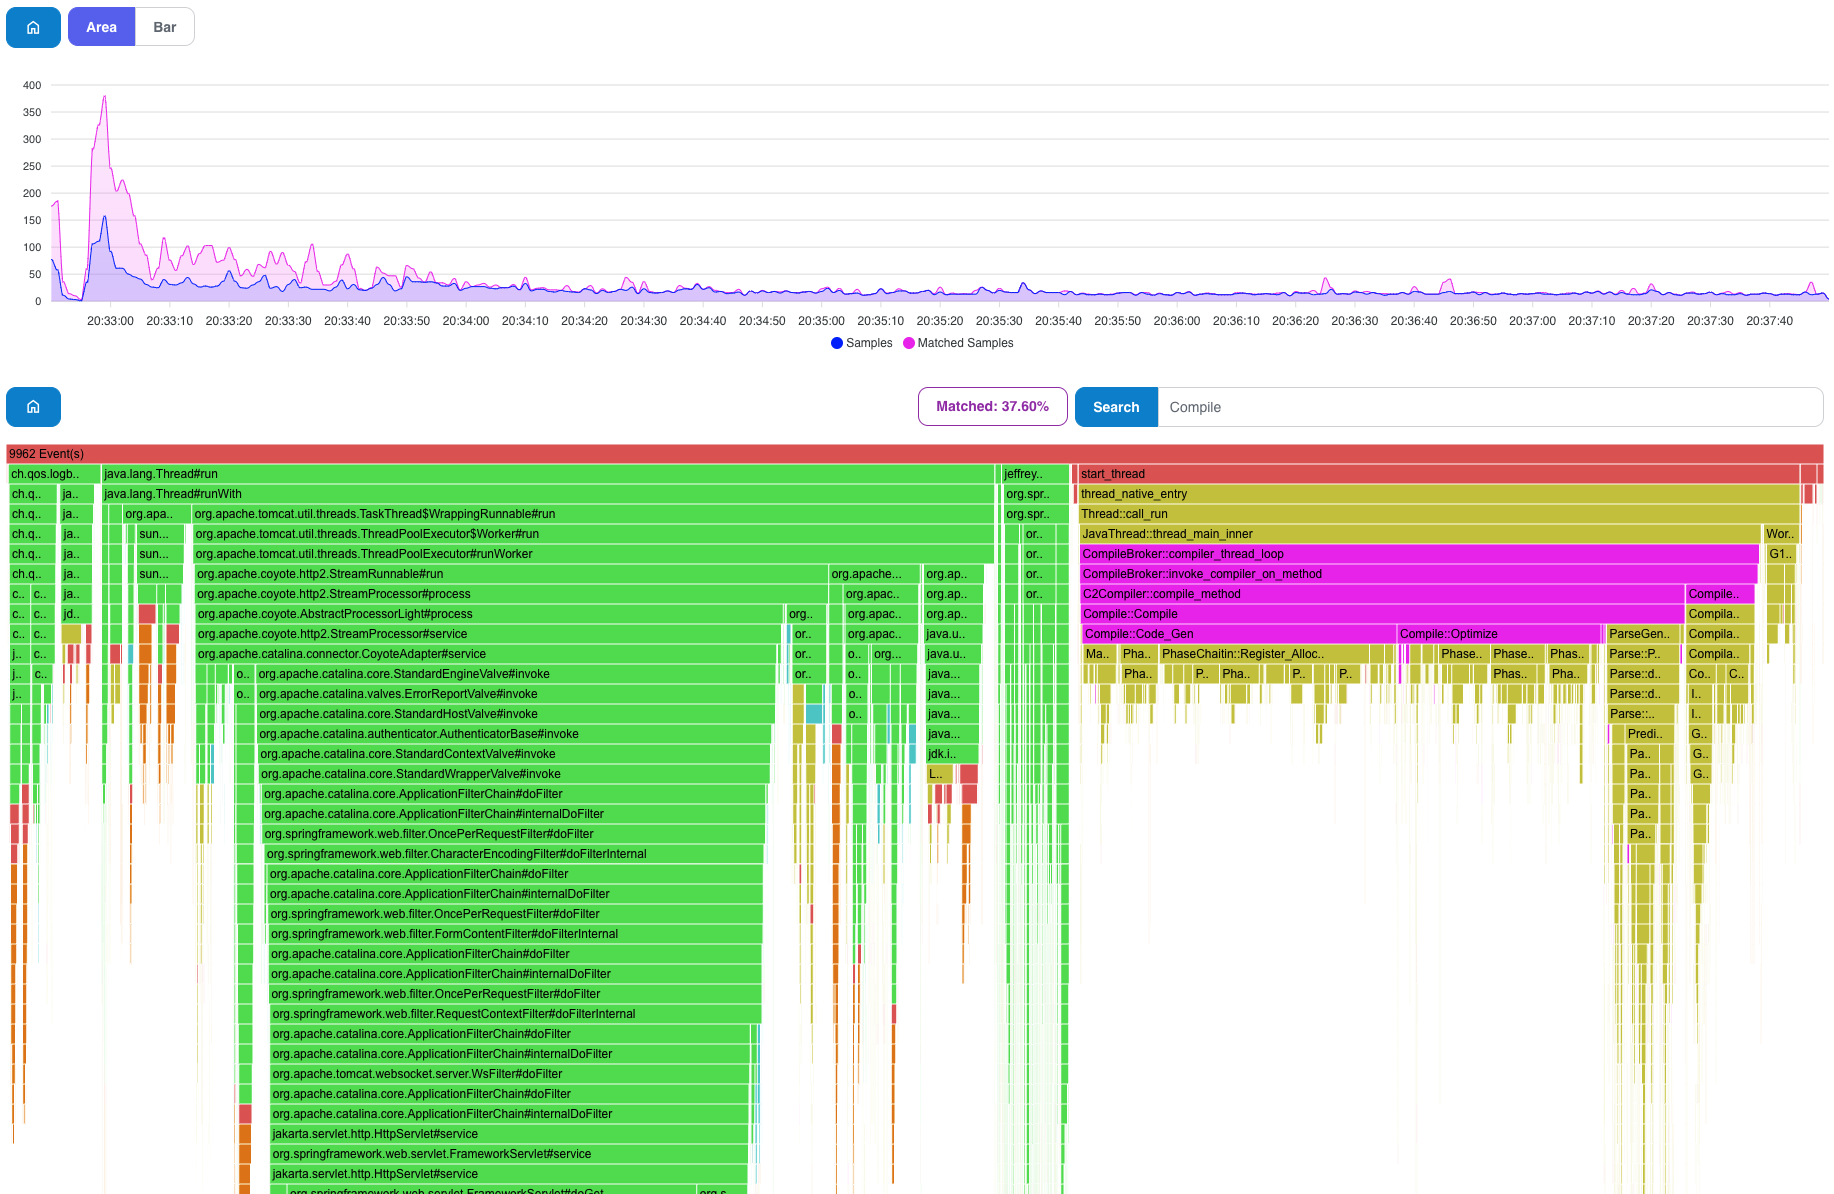
As mentioned before, it’s not possible to use zooming and searching directly from the generated graph because of its static nature. However, at least we can generate the graph with a search-pattern option to split the Timeseries graph into two series:
- samples that contain the search-pattern
- the rest of the samples that are not matched
We search for Compile pattern in the samples to point out the compilation overhead over the time of the recording.
$ java -jar jeffrey-cli.jar flame --search-pattern=Compile jeffrey-persons-full-direct-serde.jfr
Generated: <path>/jeffrey-recordings/jeffrey-persons-full-direct-serde.html
Generate Differential Flamegraphs
Differential flamegraphs are very useful if you need to compare 2 versions of the same application. It can answer the question whether the newer version does not bring any additional overhead.
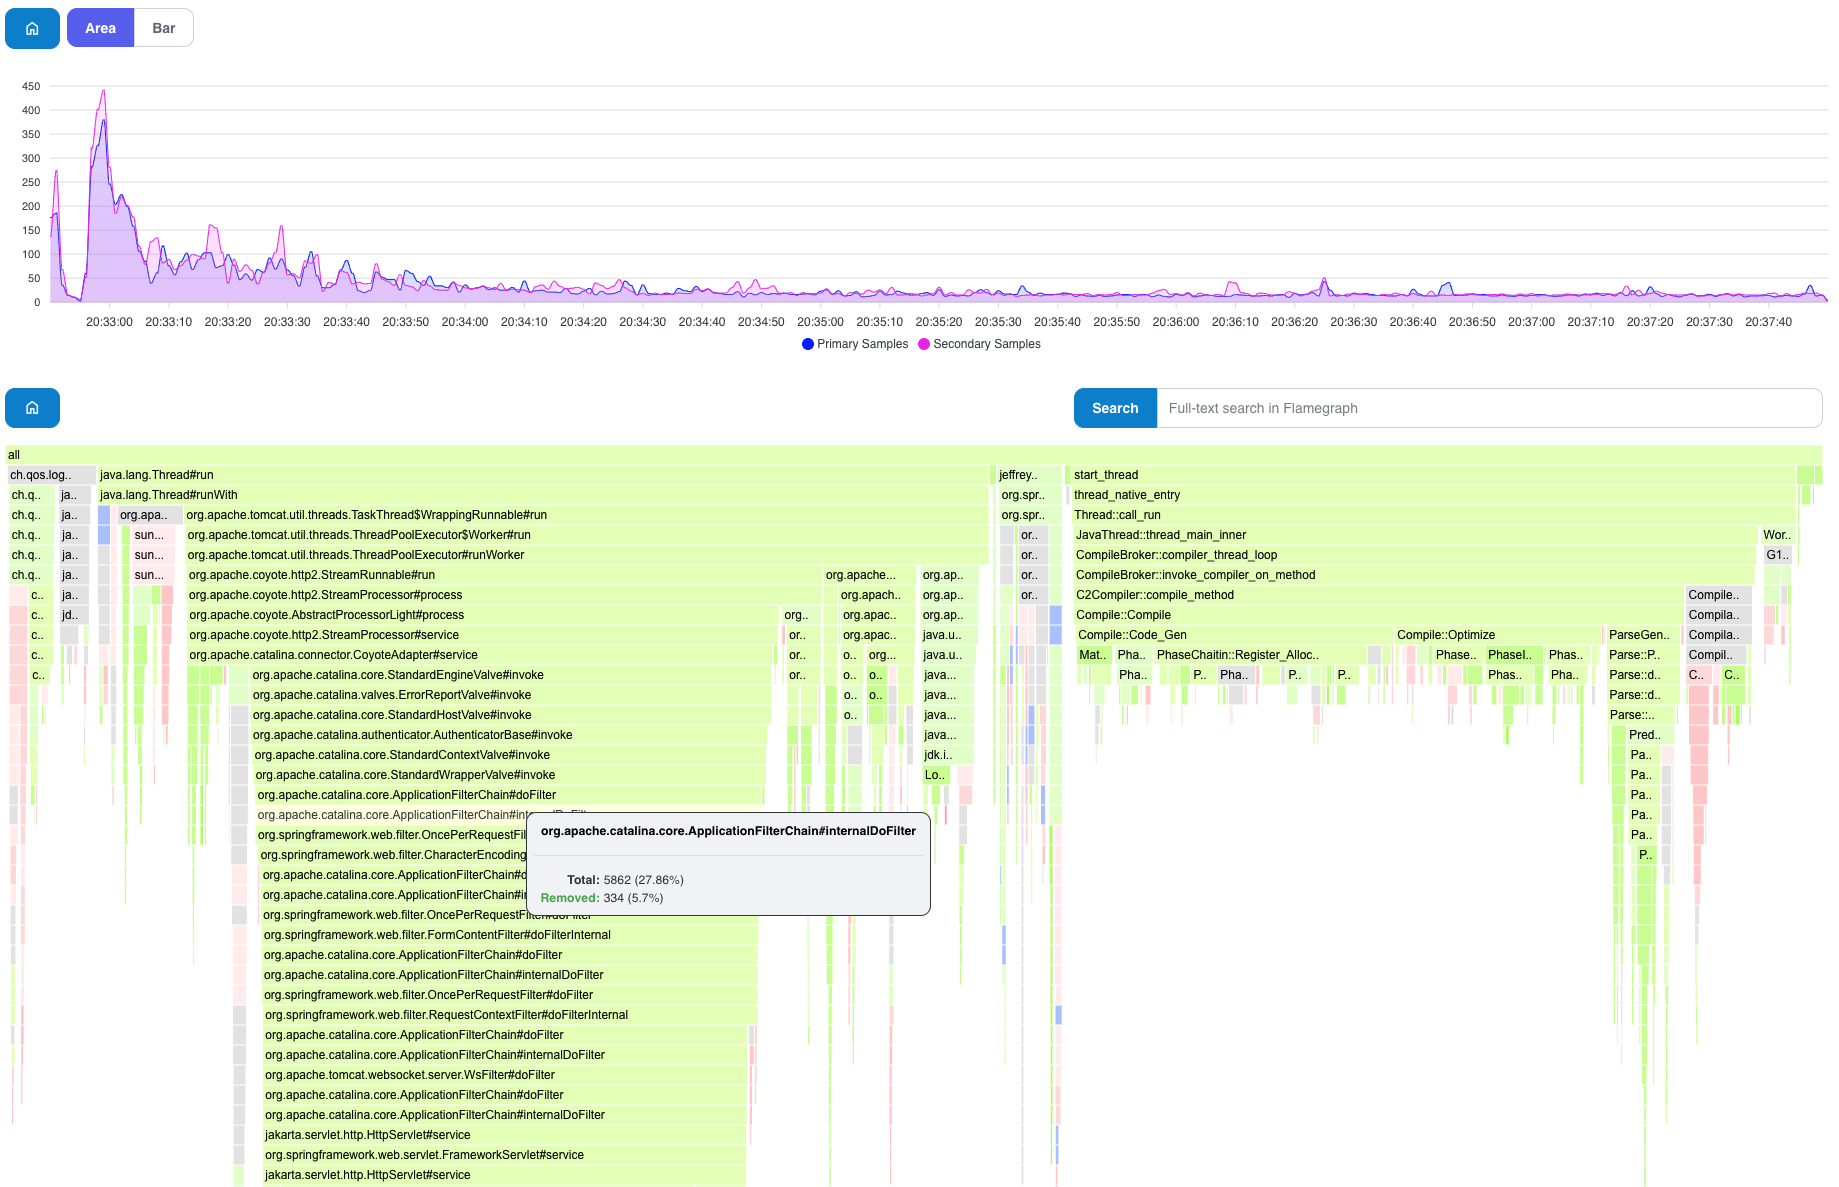
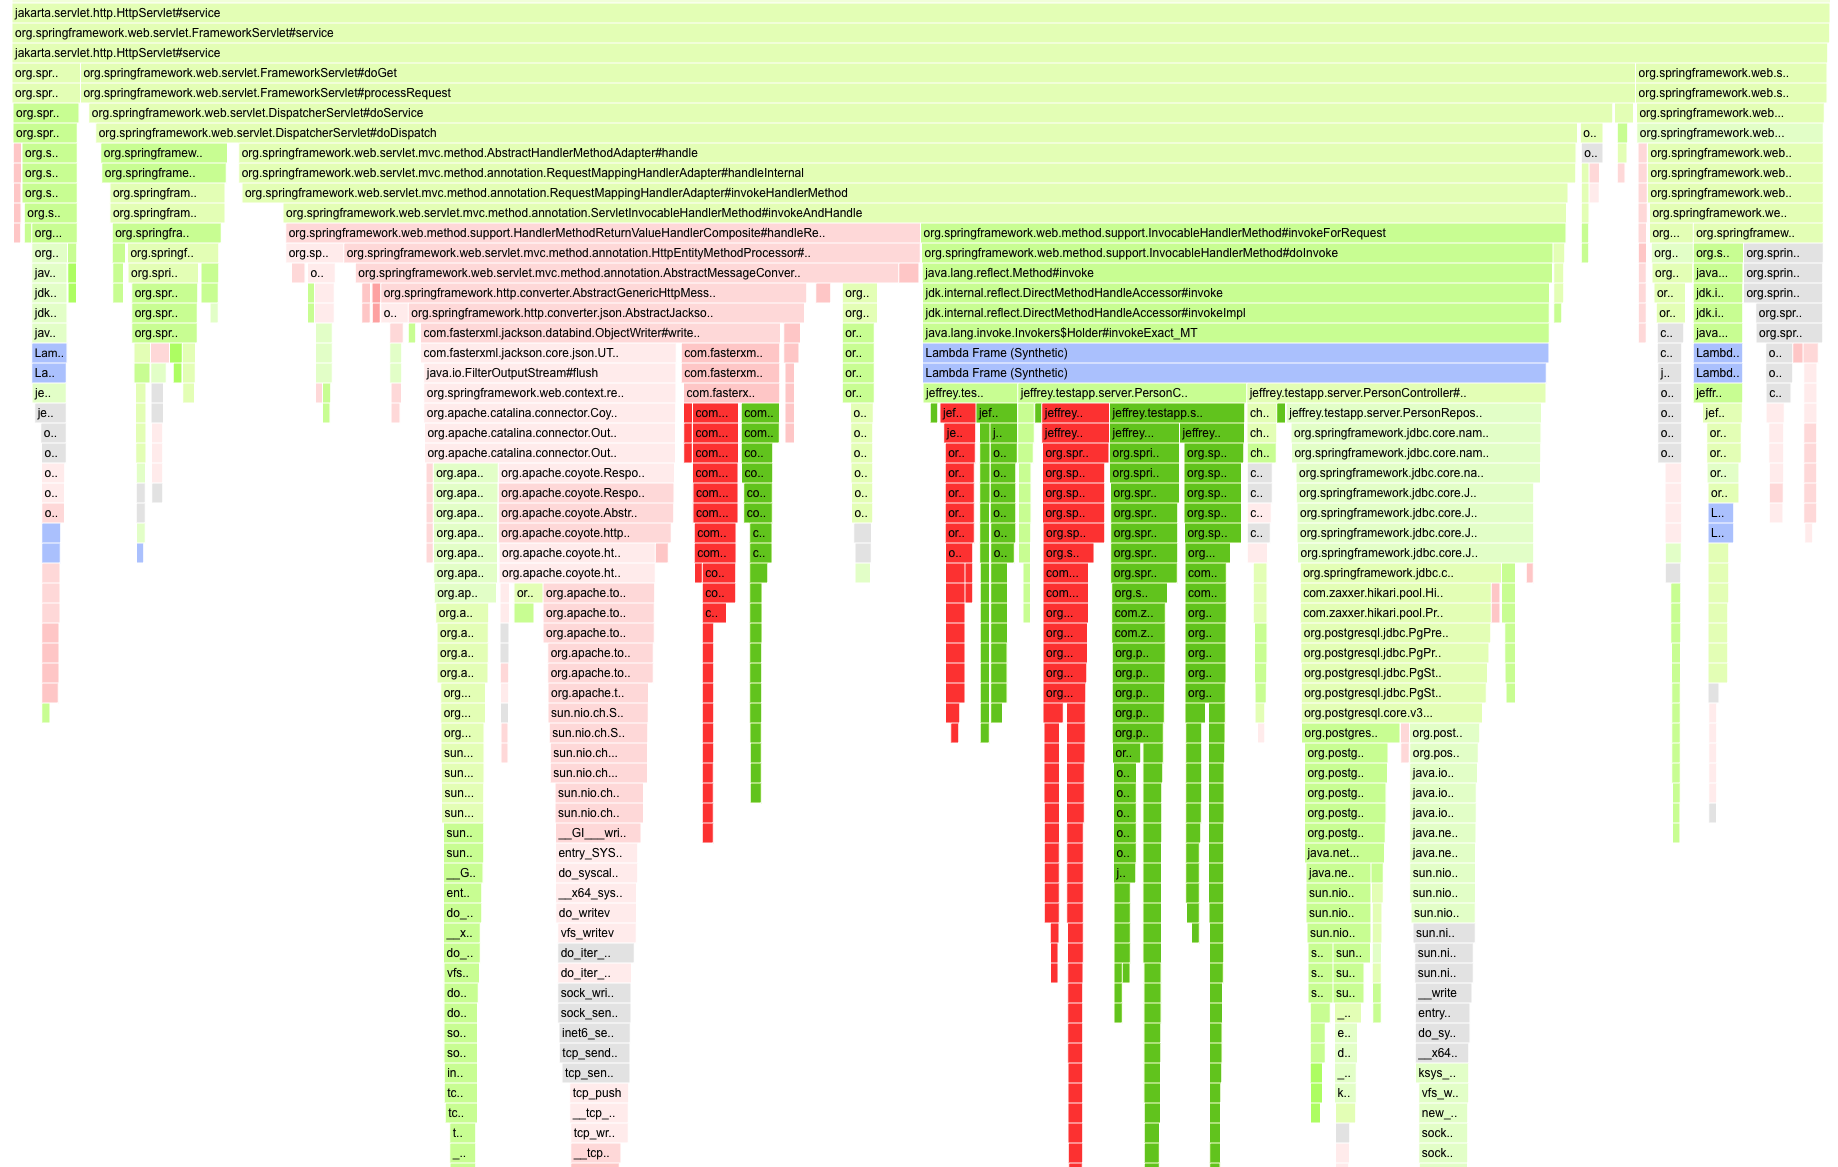
It always compares two JFR recordings: primary and secondary. Primary is the “newer” one and secondary is kind of “baseline”. The greener the frame is, the fewer events are in the primary recording. The red color shows additional events compare to the “baseline”.
Secondary events are automatically moved in time to align it with primary recording for better visualization in Timeseries graph.
It’s not easy to interpret differential graph, there are multiple ways to implement diff-graph: its matching and visualization. This implementation is based on exact number of events for the given frame, therefore, the period of the recordings needs to be the same, otherwise, if one recording would have a doubled number of events (because it ran twice as long), then it would automatically report a twice number of events for the given frame, even if the proportional part is the same.
In our case, we are comparing two executions of Jeffrey Test Application. The primary one has an “efficient” implementation compare to secondary recording.
- primary serializes directly from bytes to entity, secondary uses intermediate JSON DOM
- primary uses caching some entities, while secondary fetching more data from DB
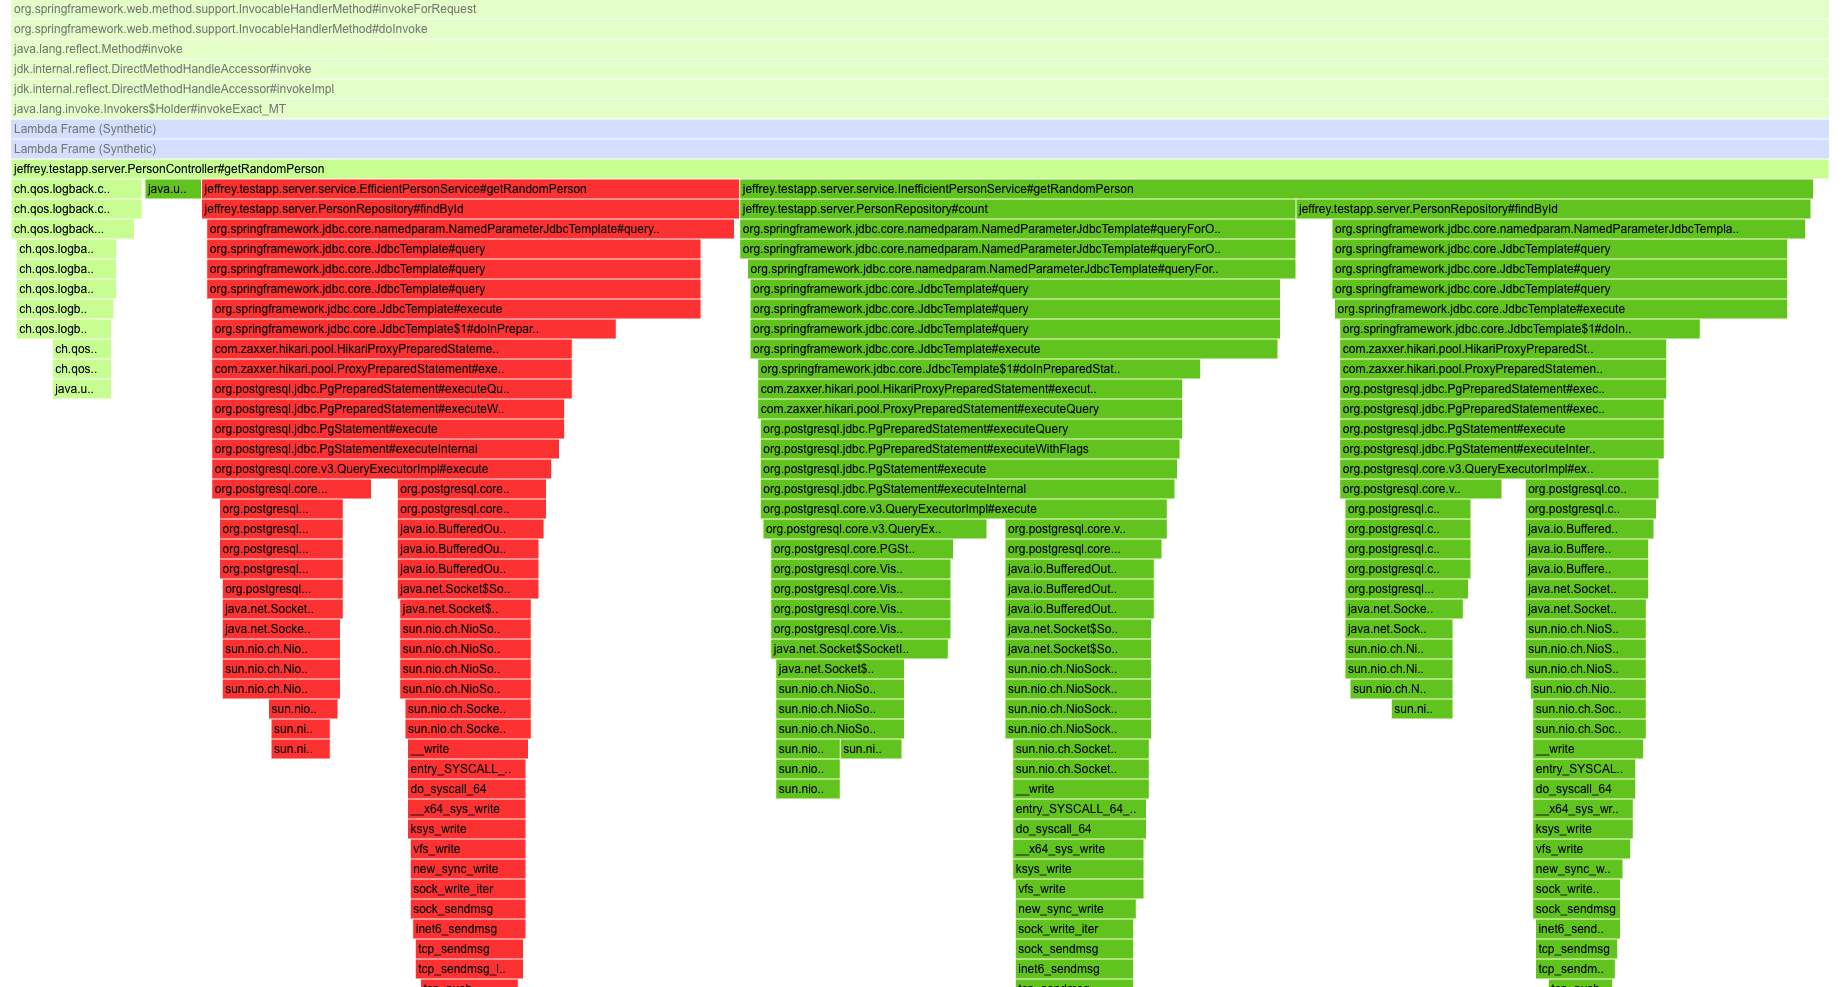
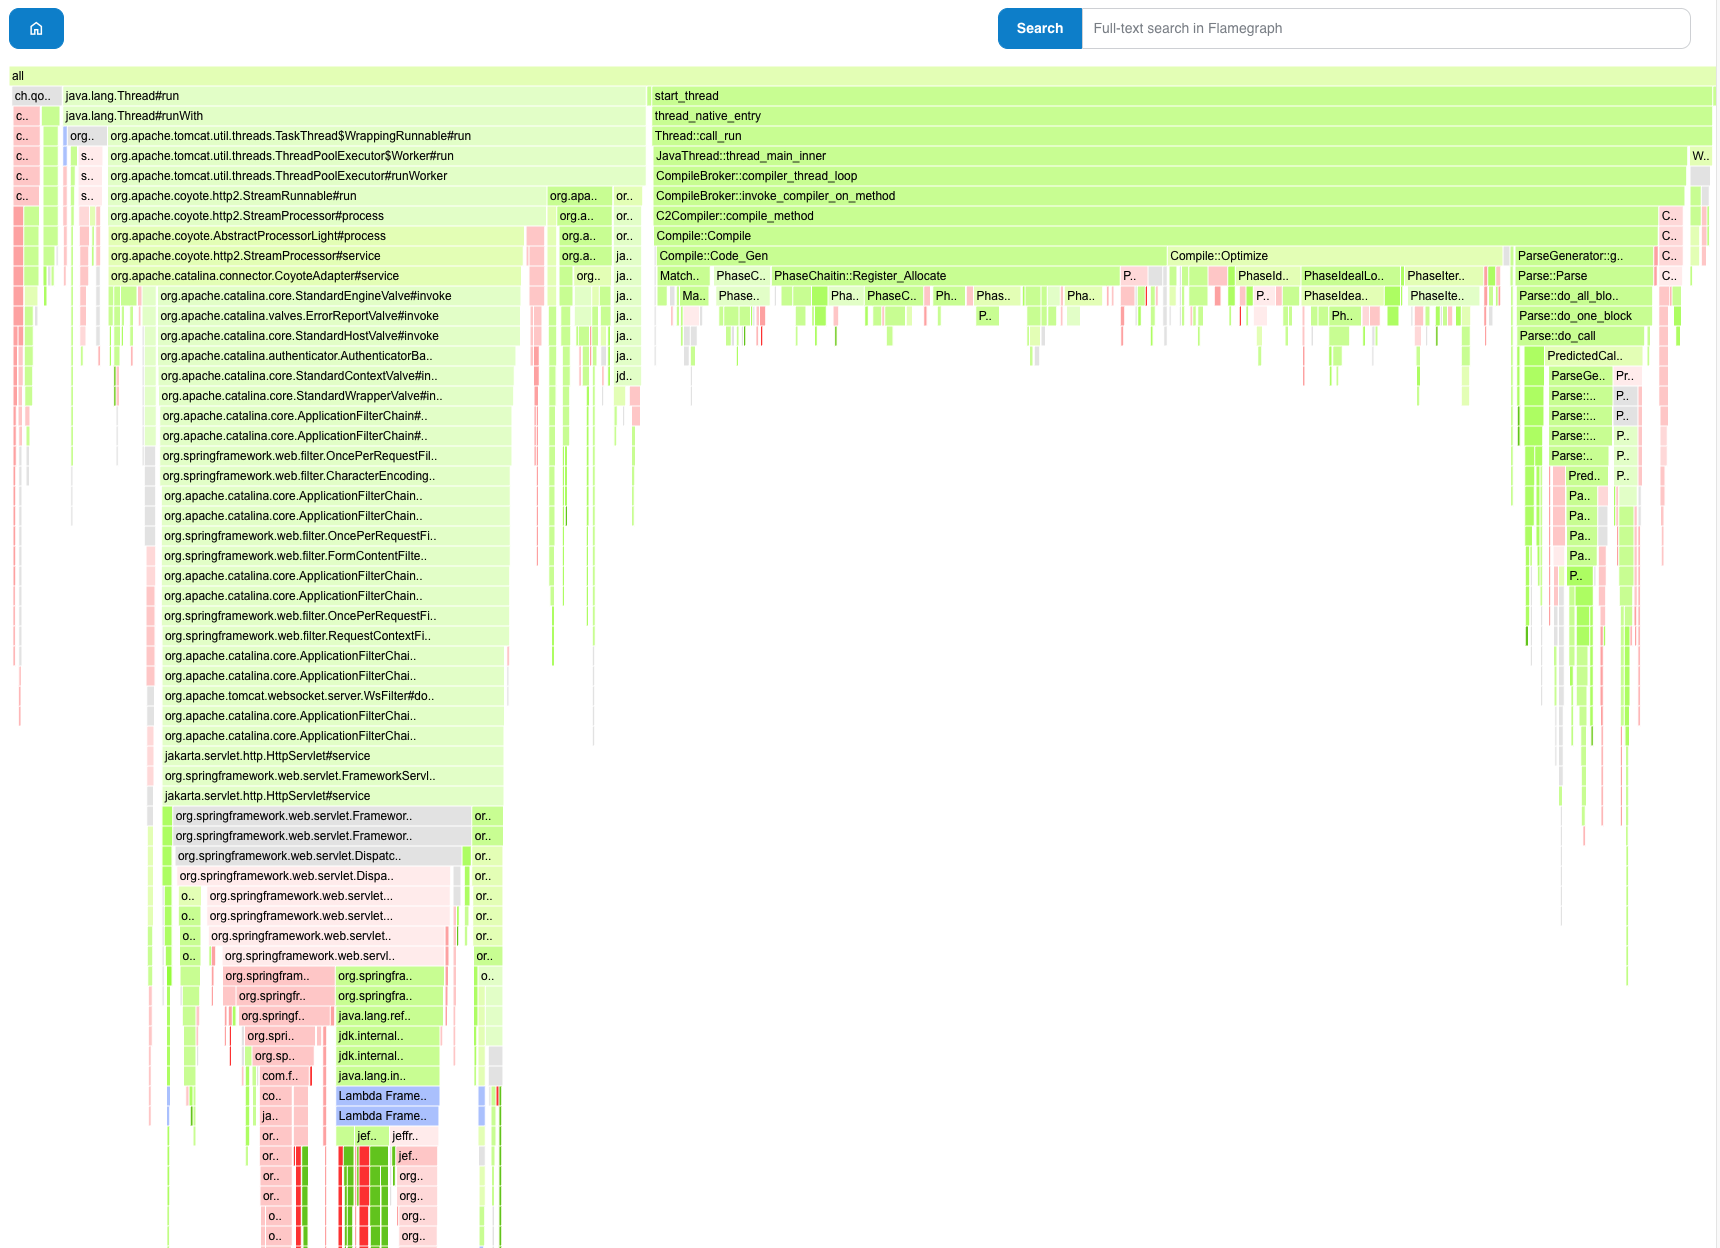
On the images below, we can see that the majority of the graph is green, ~5-6% less samples for the same period of time. Especially in jeffrey.testapp.server.PersonController#getRandomPerson, we can see that the pure GREEN part (non-existing in the primary recording = 100% Removed) standing for “Inefficient” is ~twice as big as the added one: “Efficient” (it’s red because it does not exist in secondary recording = 100% Added).
java -jar jeffrey-cli.jar flame-diff jeffrey-persons-full-direct-serde.jfr jeffrey-persons-full-dom-serde.jfr
Generated: <path>/jeffrey-recordings/jeffrey-persons-full-direct-serde.html
Below we can notice 100% added and removed parts of the stacktraces. Moreover, the zoomed area contain an synthetic Lambda Frame that replaces some kind of generated methods (most likely called by Method Handles). This kind of generated code would result with 100% difference between the two versions (compilations) of the same application and calling lambdas very often end up with generated synthetic methods. This is a way to step over the generated frame and don’t cripple the rest of the graph.
Generate Sub-Second Graphs
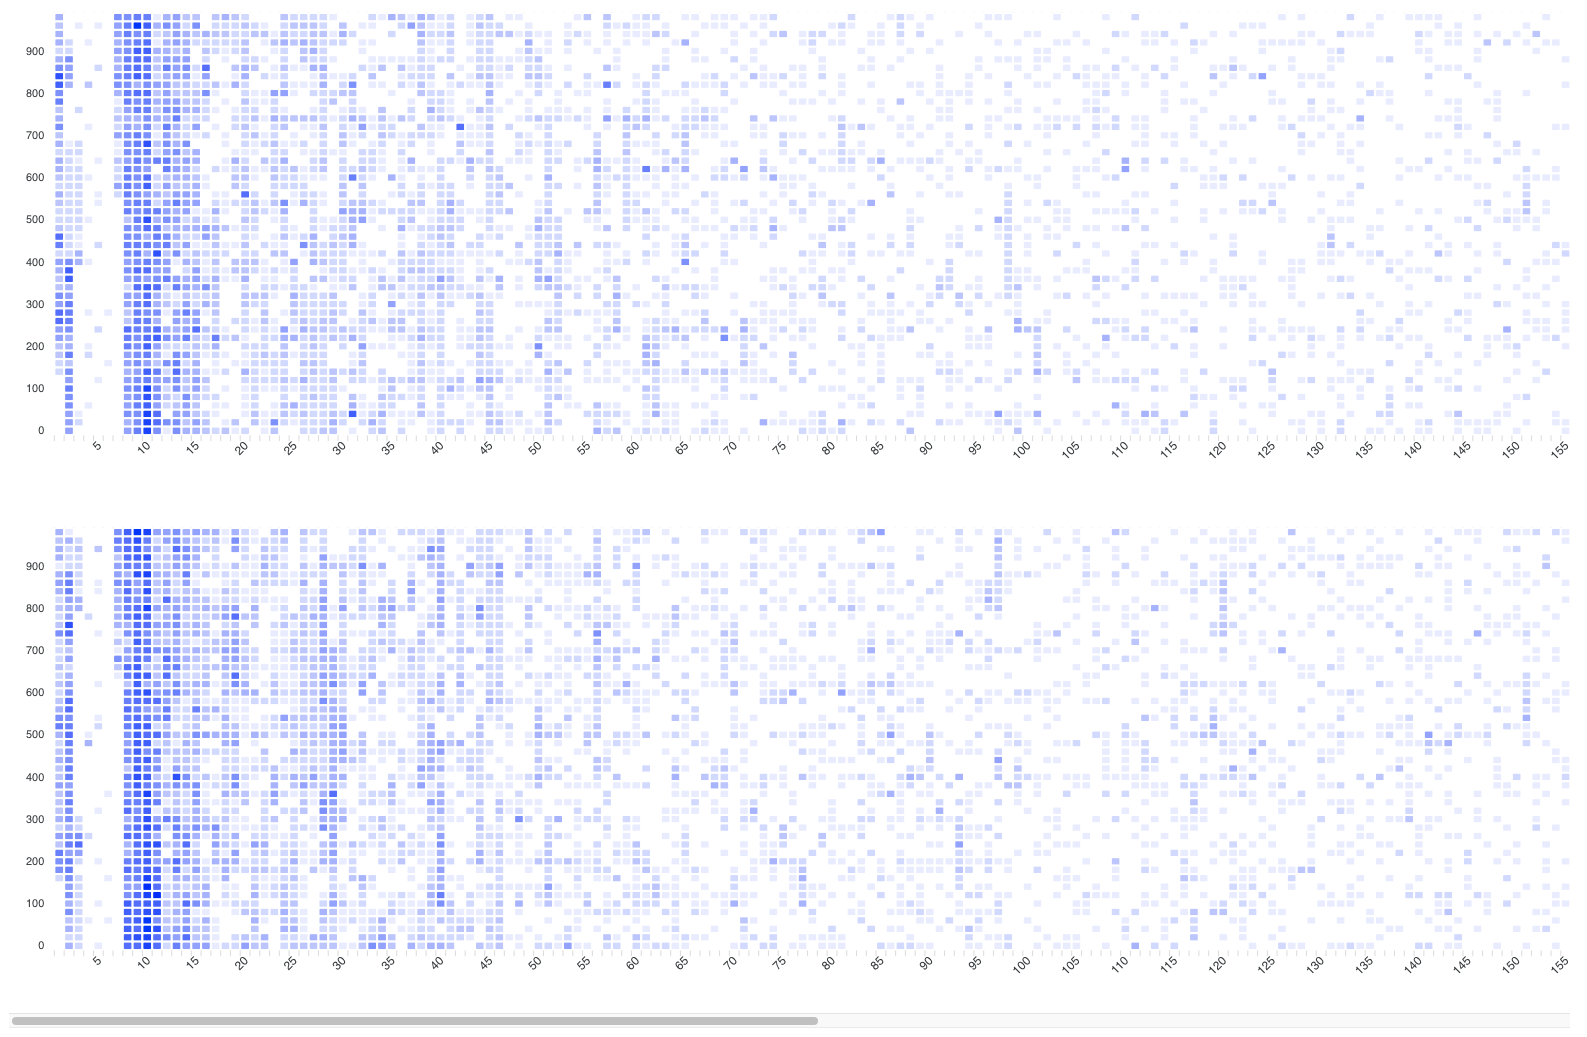
Sub-Second graphs are heatmaps visualizing samples over the time in ten of milliseconds scale. Seconds on the X-axis and milliseconds on Y-axis. Every square is 10 millis of the execution in the given second. The darker the square is, the more events belong to the given time period compared to other periods. At the time of writing this blog post, the sub-second graph supports the first 5 minutes of the execution.
Therefore, it’s a good fit for low-level investigation of Startup problems.
It’s also very good visualization techniques for very short but very intensive tasks such as triggered JIT Compilation or GC. These tasks can last tens of milliseconds, and sometimes we can notice a periodicity, or some kind of repeating pattern.
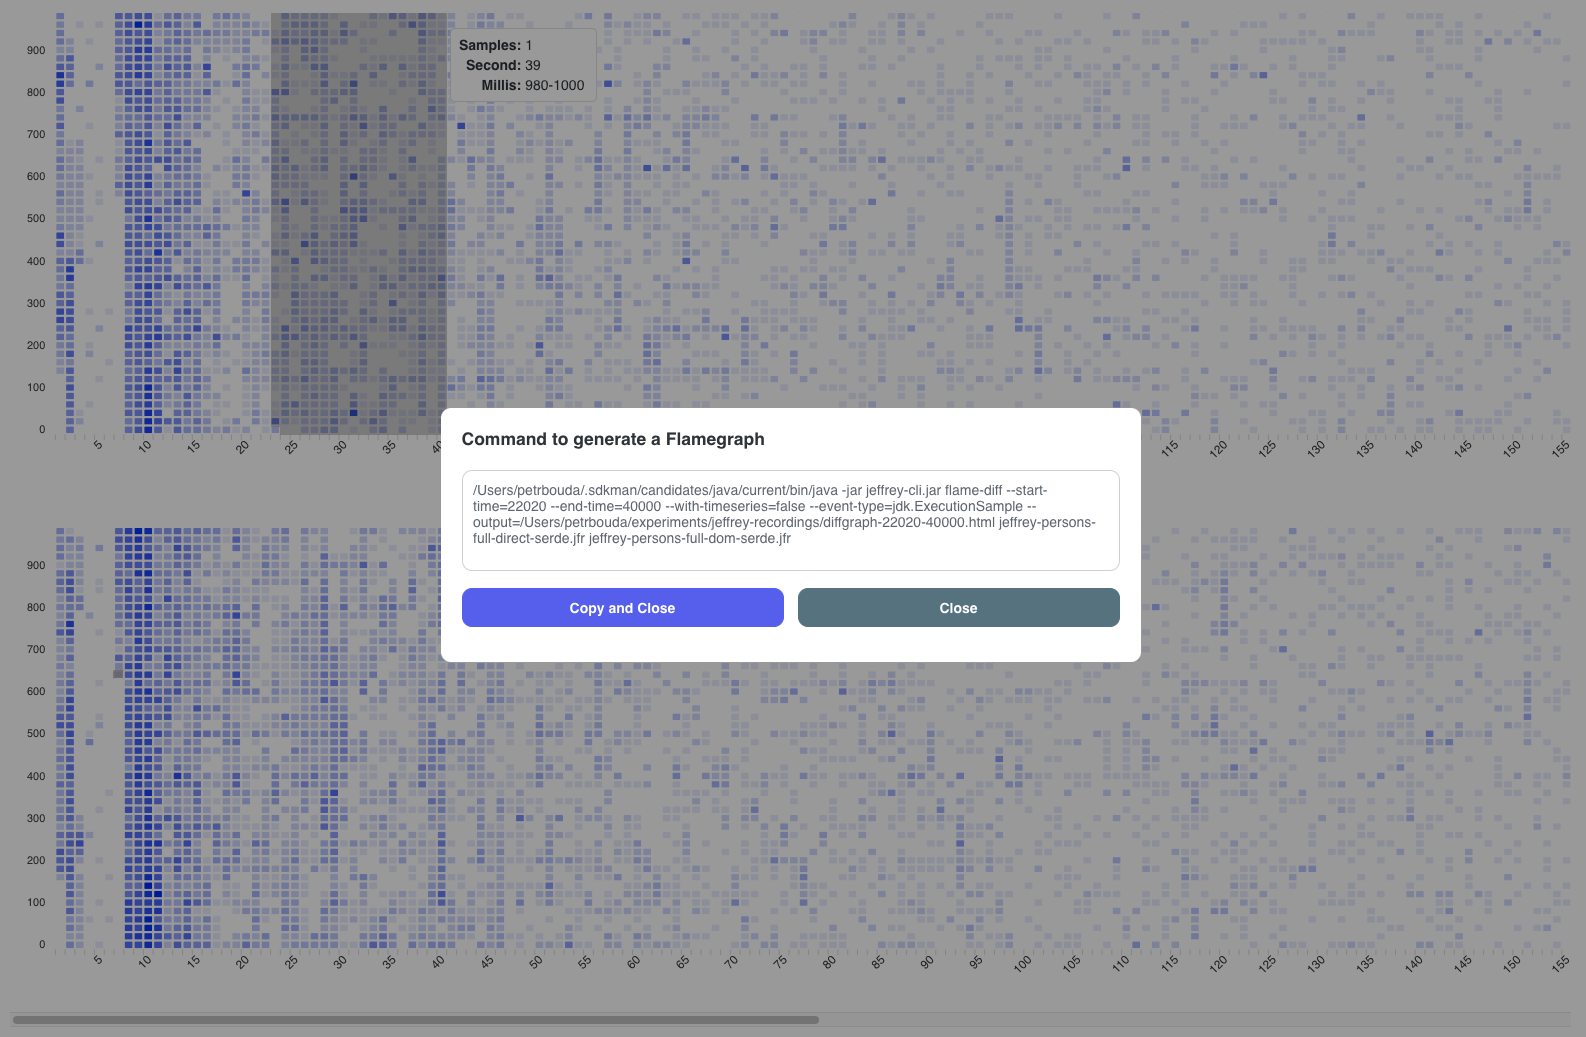
- Sub-Second Graphs generated using CLI cannot directly generate a flamegraph from the selected area as Jeffrey Application can. However, it provides a command for generating the given flamegraph using a follow-up command execution in your terminal.
$ java -jar jeffrey-cli.jar sub-second --help
Usage:  sub-second [-hVw] [-e=<eventType>] [-o=<outputFile>] <jfr_file>
Generates Sub-Second graph (the first 5 minutes)
      <jfr_file>   One JFR file for generating sub-second graph
  -e, --event-type=<eventType>
                   Selects events for generating a graph (e.g. jdk.ExecutionSample)
  -h, --help       Show this help message and exit.
  -o, --output=<outputFile>
                   Path to the file with the generated graph (default is the current folder with a filename '<jfr-name>.html')
  -V, --version    Print version information and exit.
  -w, --weight     Uses event's weight instead of # of samples (currently supported: jdk.ObjectAllocationSample, jdk.ObjectAllocationInNewTLAB, jdk.
                     ObjectAllocationOutsideTLAB, jdk.ThreadPark, jdk.JavaMonitorWait, jdk.JavaMonitorEnter)
Let’s show just the simple commands for only a single recording and for differential graph because event-type and weight work the same way as in case of flamegraphs.
java -jar jeffrey-cli.jar sub-second jeffrey-persons-full-direct-serde.jfr
Generated: <path>/jeffrey-recordings/jeffrey-persons-full-direct-serde.html
Provided command after selecting the interesting area:
<JAVA_HOME>/bin/java -jar jeffrey-cli.jar flame --start-time=6560 --end-time=15000 --with-timeseries=false --event-type=jdk.ExecutionSample --output=<path>/jeffrey-recordings/flamegraph-6560-15000.html jeffrey-persons-full-direct-serde.jfr
Generated: <path>/jeffrey-recordings/flamegraph-6560-15000.html

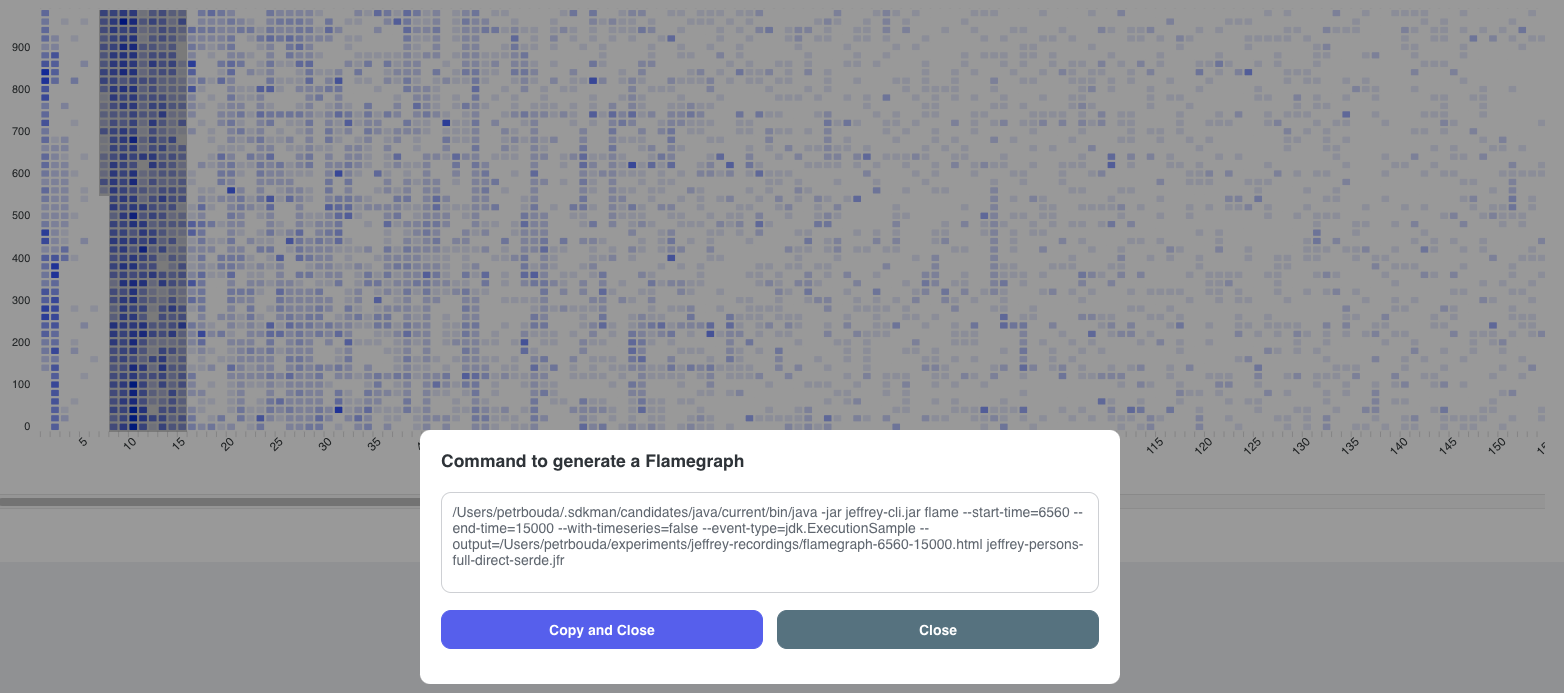
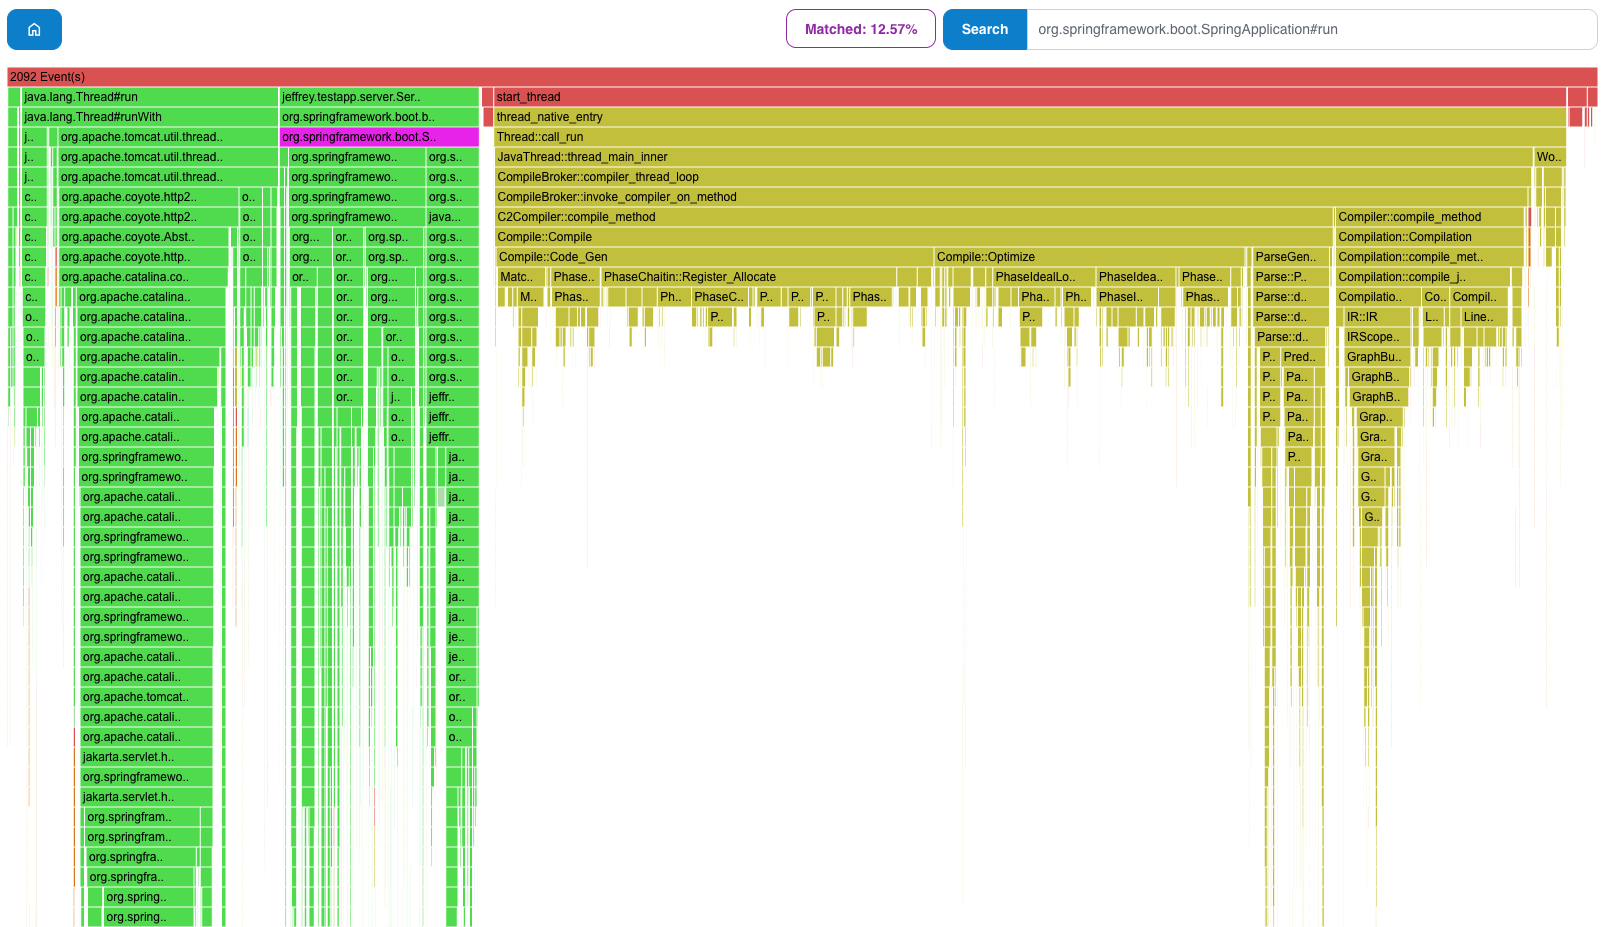
Our final flamegraph says that the majority of the selected part belongs to JIT Compilation and SpringBoot Bootstrap. However, it started handling HTTP requests.
Generate Differential Sub-Second Graph
It’s a feature to compare startups of two versions of the same applications.
java -jar jeffrey-cli.jar sub-second-diff jeffrey-persons-full-direct-serde.jfr jeffrey-persons-full-dom-serde.jfr
Generated: <path>/jeffrey-recordings/jeffrey-persons-full-direct-serde.html
The last few words
That’s it from the current implementation of Jeffrey CLI (version 0.2). Hope, you enjoy it!
Try it out, file the bugs, and if you like the product, you can support it in any way :)